")
This page contains the data and analysis of a brain wave recording session I did using a Muse EEG Headband.
Session Characteristics
- 15/03/2024, 18:29
- I had my eyes open and blinking every 10 seconds, timed with a stopwatch.
- The purpose of this session was to try to understand better how blinking artifacts show in the recorded brain waves.
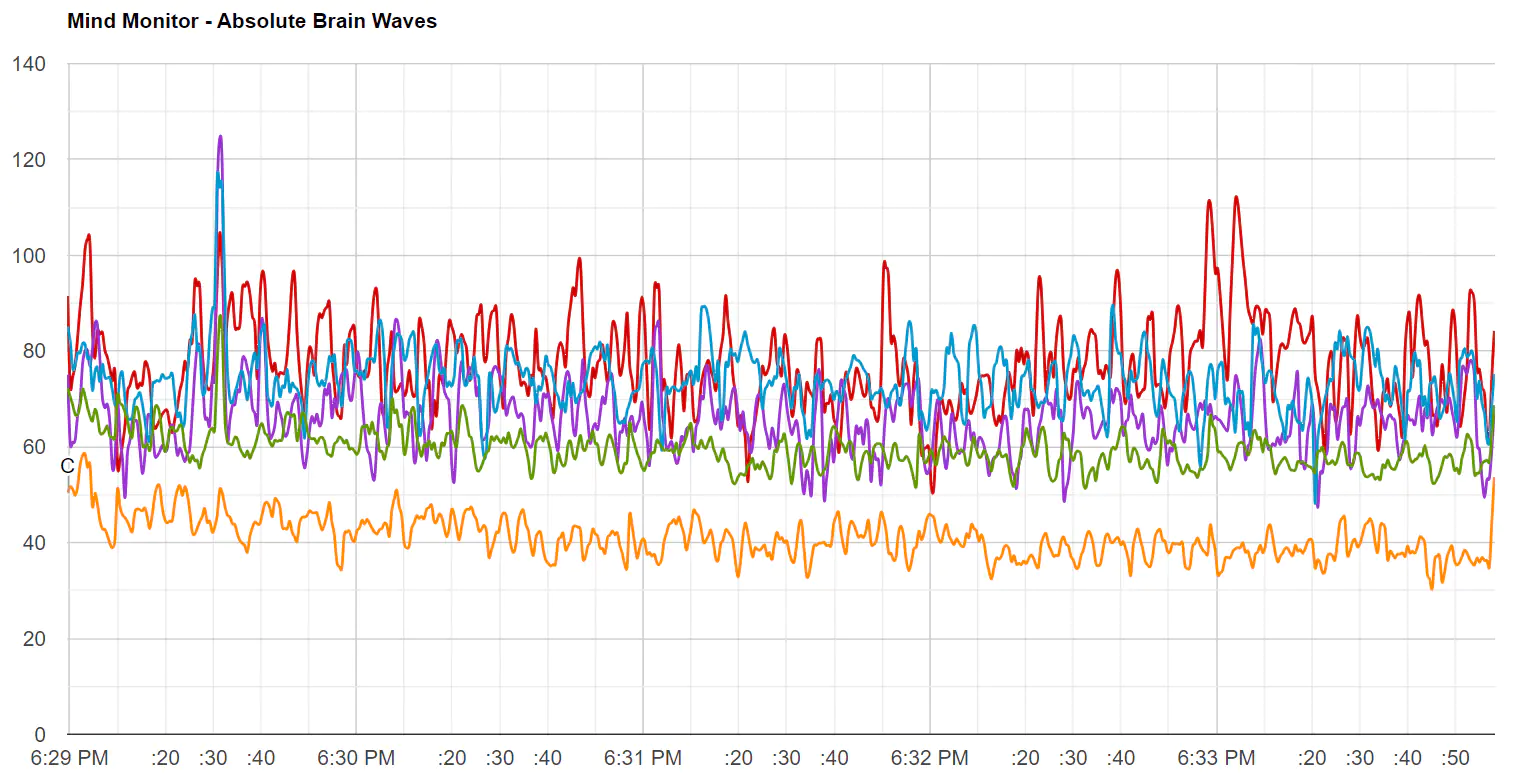
All Sensors – Absolute Levels
Looking at the graph encompassing all brainwaves from all sensors, we can see regular peaks, withDeltabrainwaves having the largest amplitudes. This is expected since eye-blinking artifacts will affect the slowest brainwaves the most1
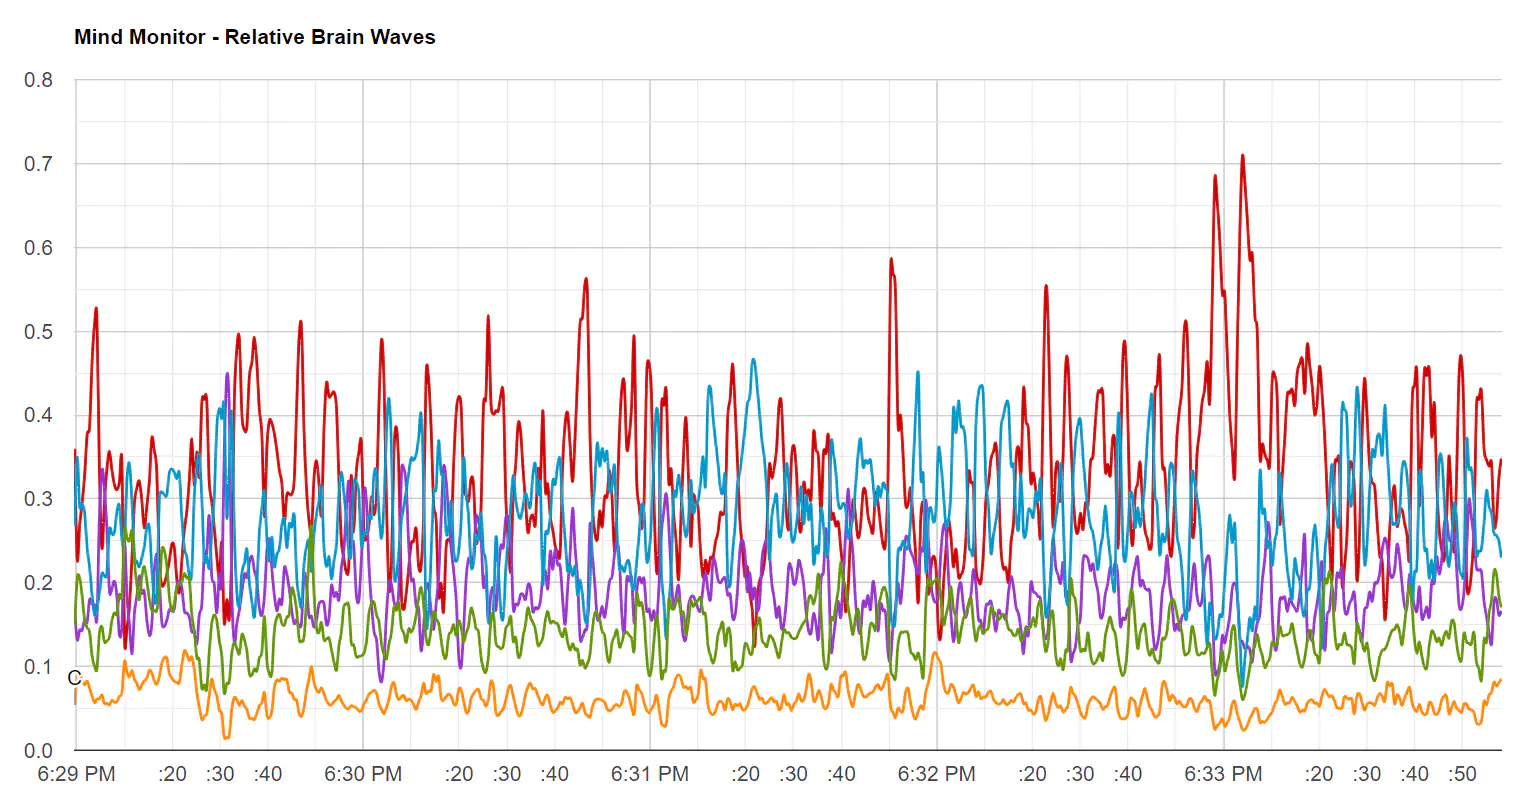
All Sensors – Relative Levels
Switching to a relative graph, we can visually see that thoseDeltapeaks gain even more prominence over other brainwaves, meaning that a large percentage of the EEG signal is constituted byDeltabrainwaves. Seems to be consistent with what was expected so far.
Isolating Delta
SinceDeltahas such importance in this session. we should simplify our analysis for now and focus only on that type of brainwave. Below you will find four images, each showingDeltabehavior in the Front-Right sensor (AF8), Front-Left sensor (AF7), Back-Right sensor (TP10) and Back-Left sensor (TP9).
Let’s see ifDeltaactivity behaves synchronously with the 10-second interval blinks. I’ve drawn multiple arrows connected by a horizontal line, representing 10-second intervals on the graph. Ideally, we’d like to seeDeltaactivity lining up with the arrows, but is that what we’ll find?
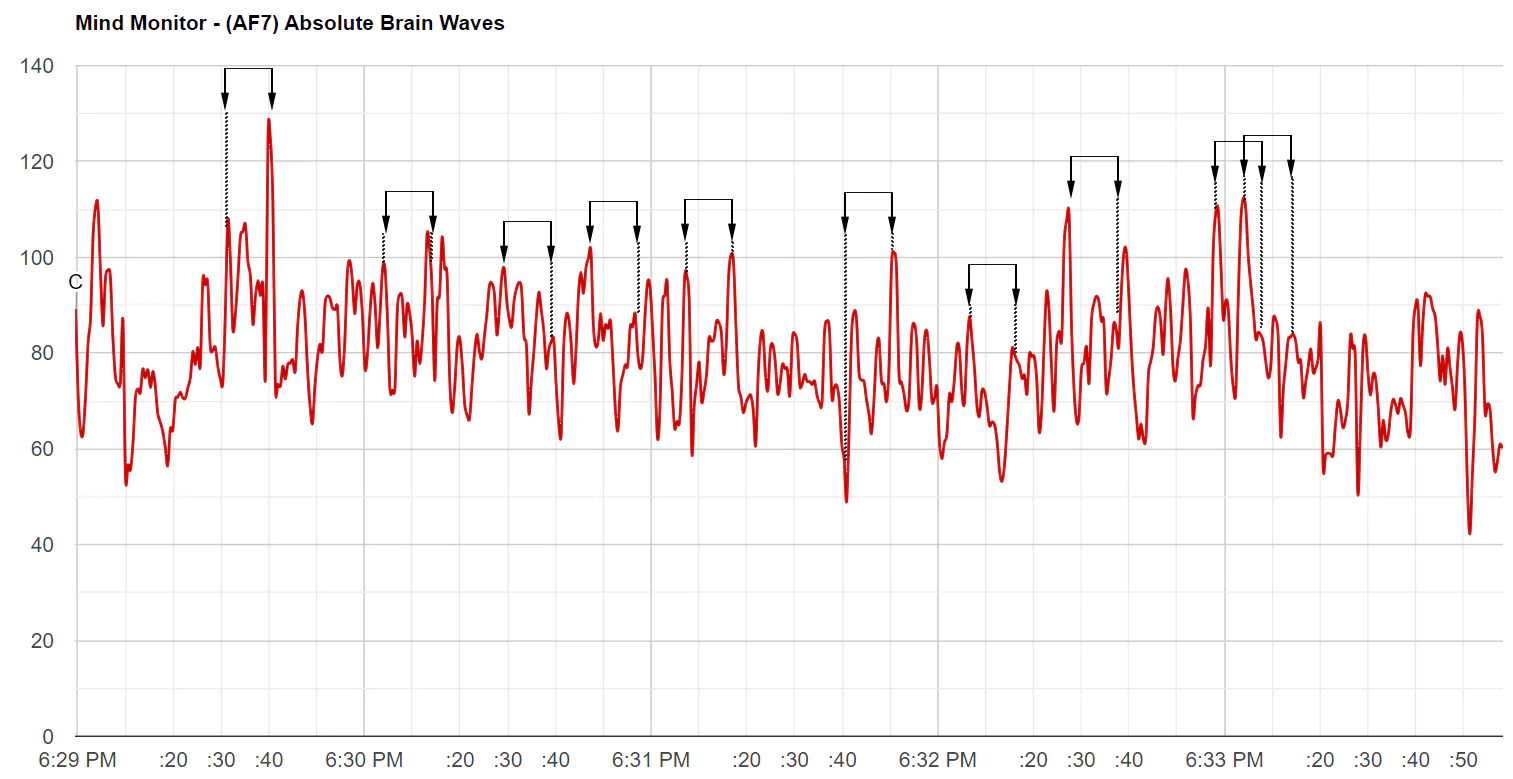
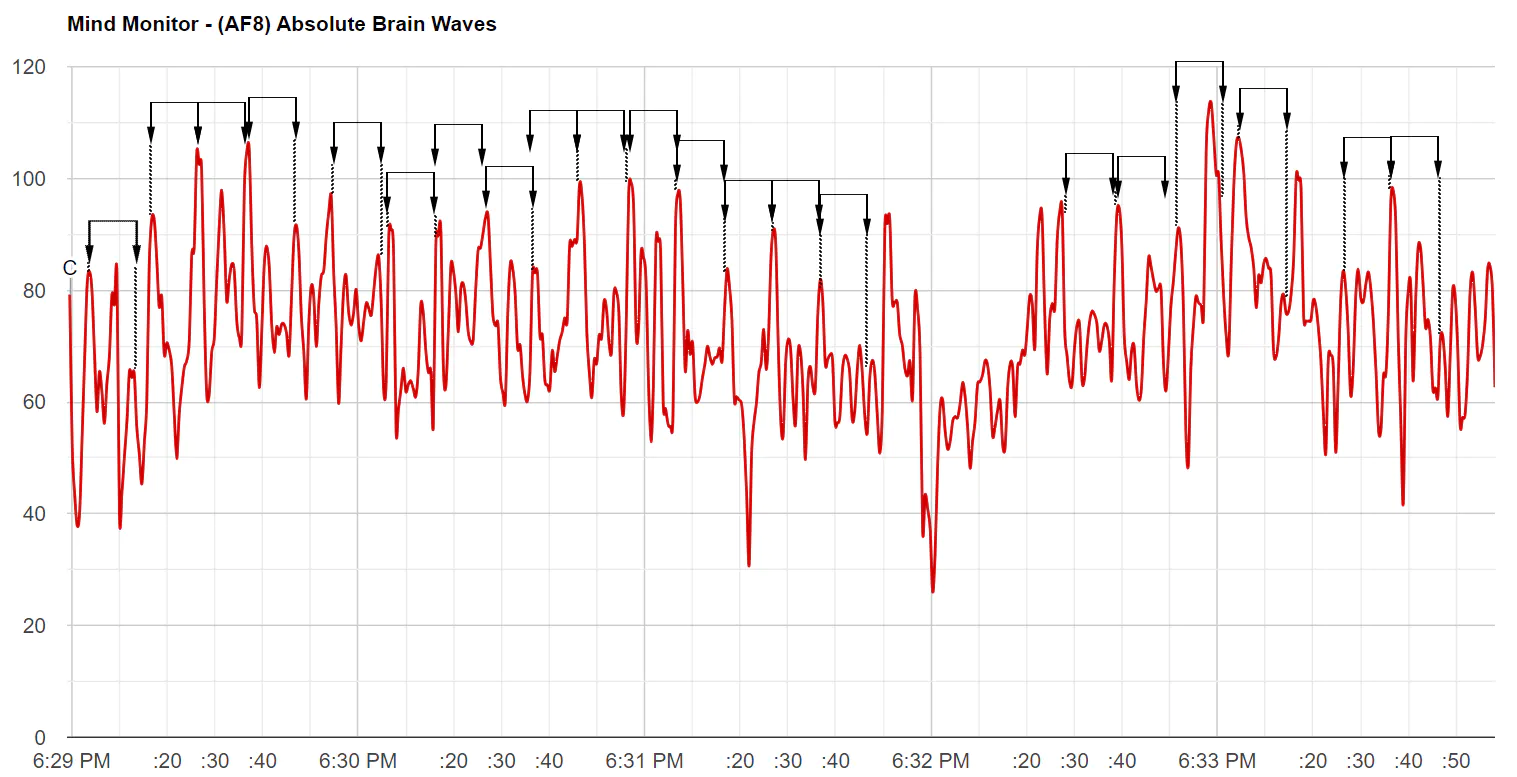
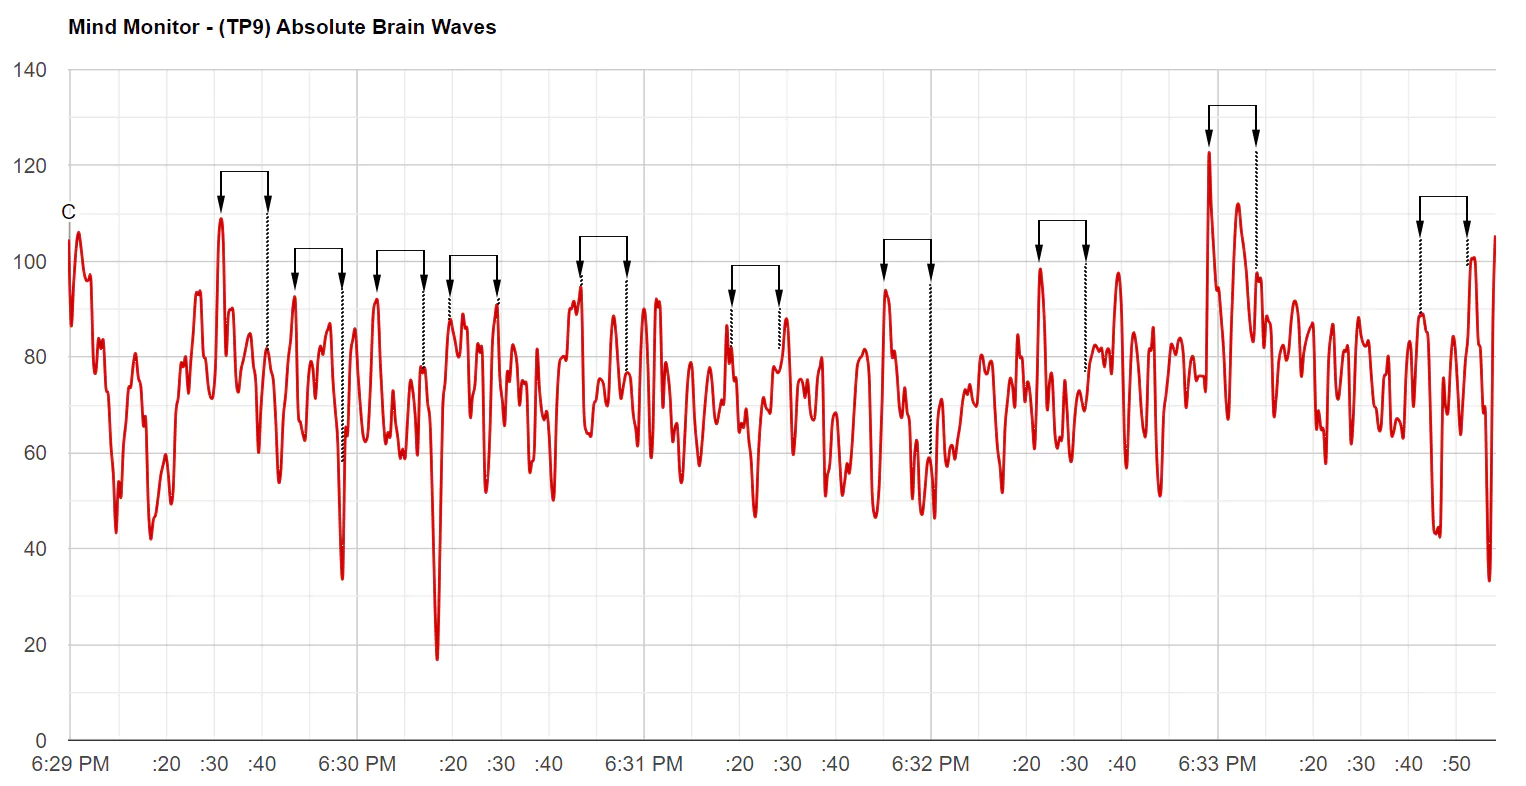
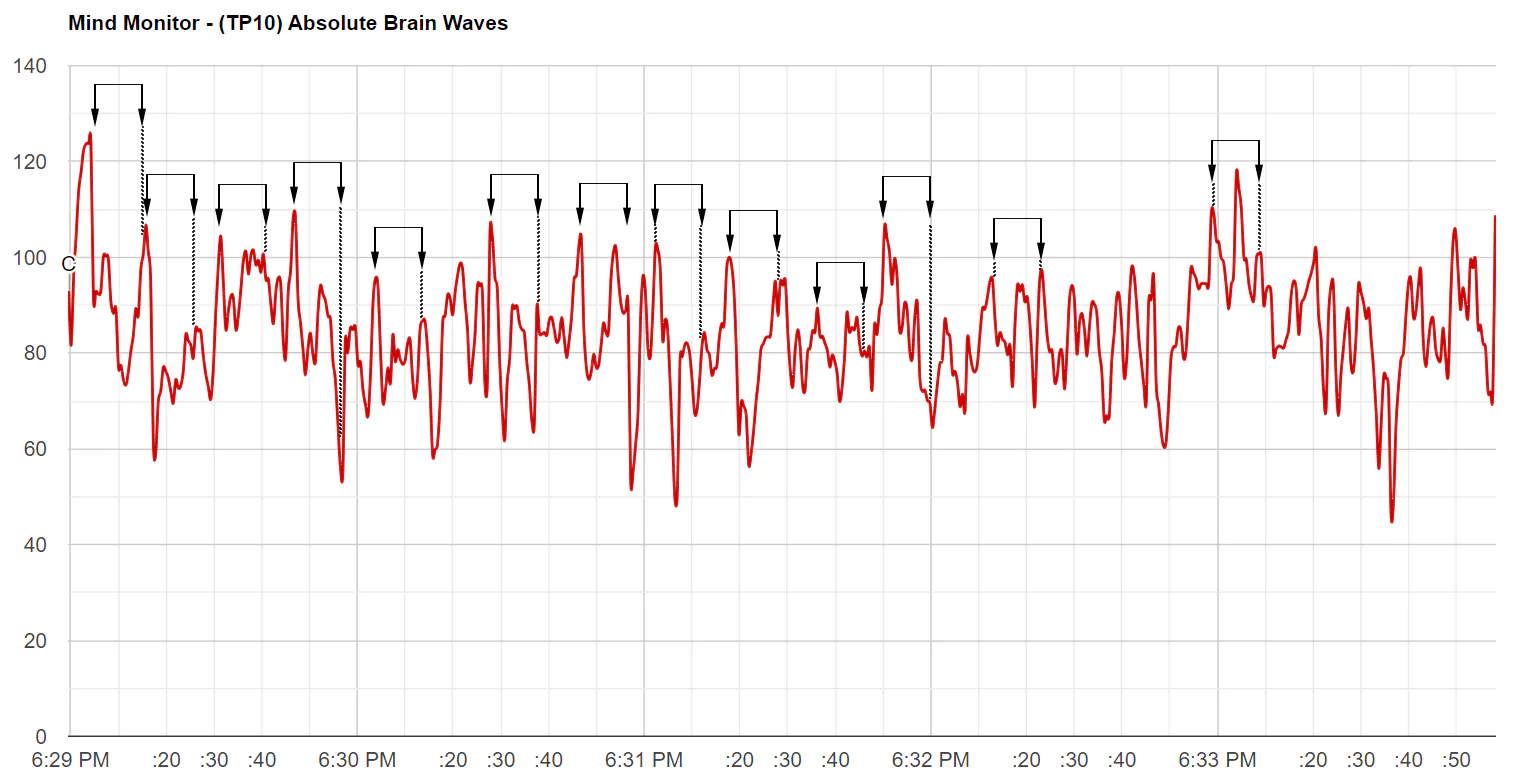
As we can see, some peaks align well with the arrows sometimes, and sometimes they don’t. So, we can’t really say there is a perfect correlation between blinking and brainwave activity.
However, in the Front-Right sensor (AF8) there is a large streak of peaks that align with the arrows. So it seems this sensor picked up the most signal artifacts from blinking. EEG analysis experts mention that blinking artifacts are mostly detected in the front parts of the brain2, so it checks out.
I will also leave to the neuroscientists to explain why the artifacts are being picked up asymmetrically. But I will mention that this behavior has also been observed in other sessions like session 26.
Zooming In on AF8
Zooming in on the AF8 sensor, we can see closer how all the brainwaves react to the blinking.
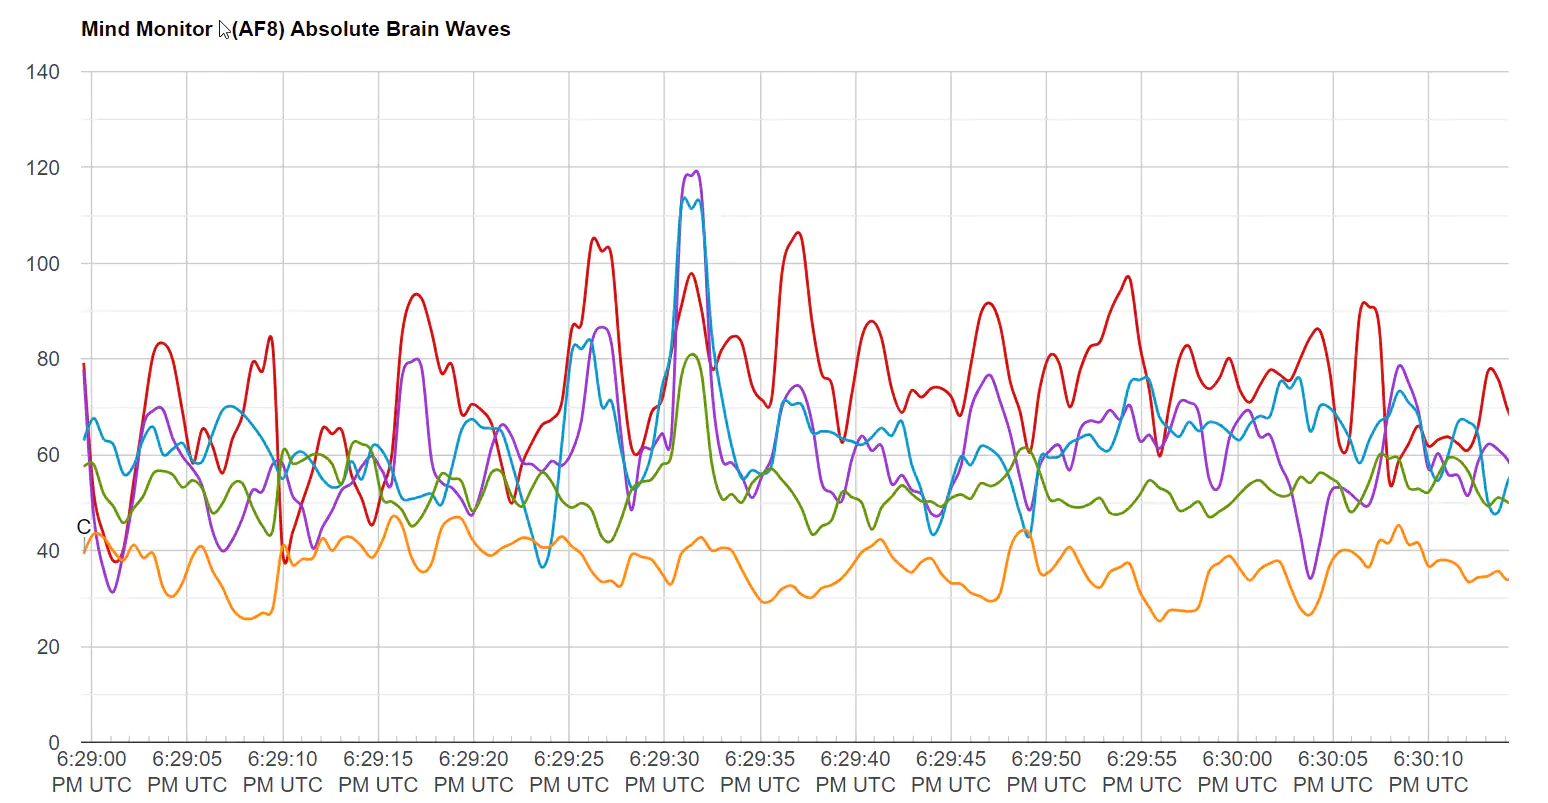
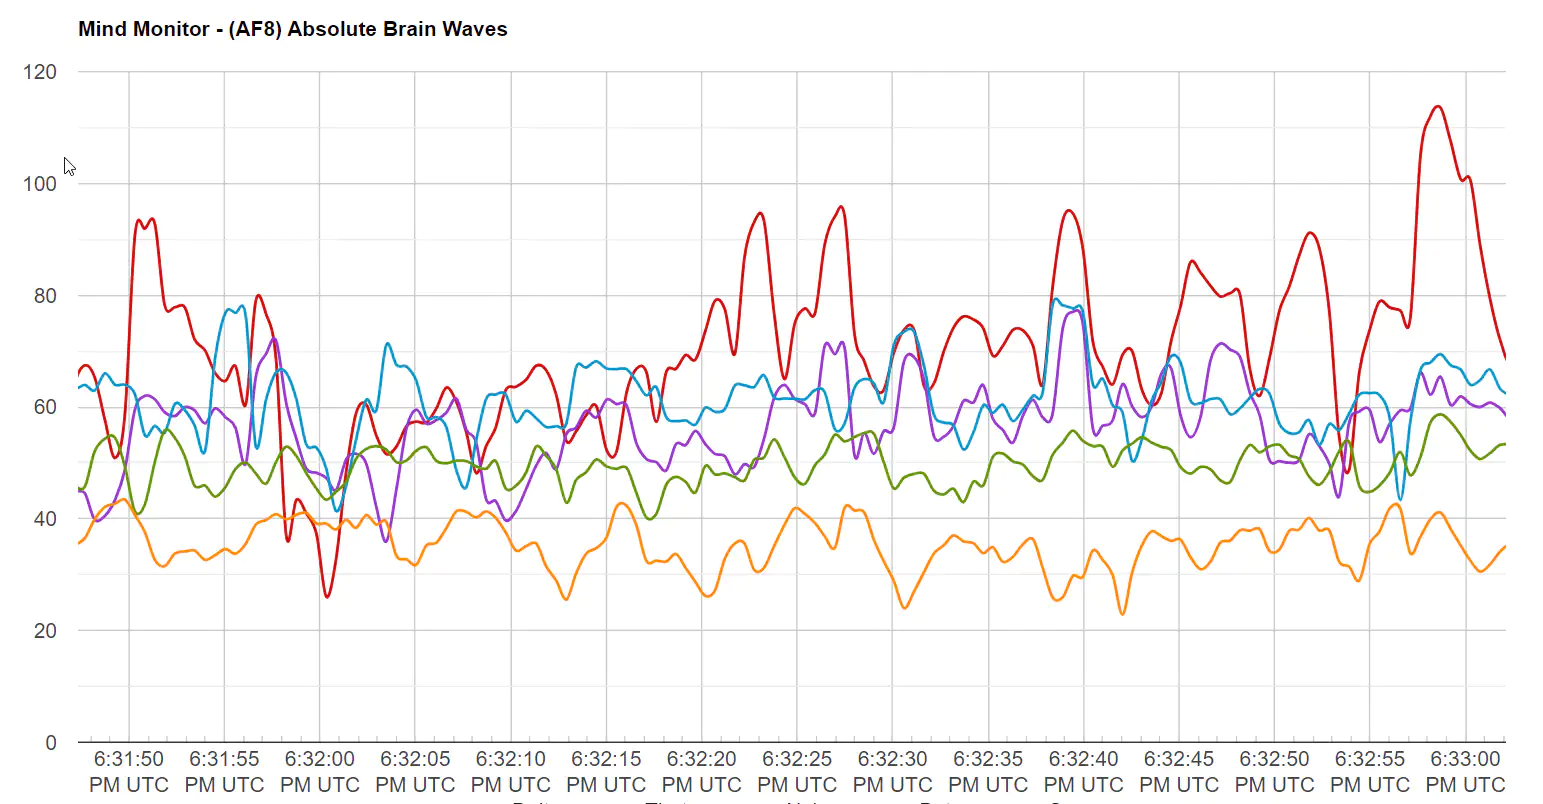
In terms of reactivity, as one would expect, it decreases as we increase the brainwave frequency — theDeltabrainwaves present the largest oscillations, forming the clearest peaks and valleys.Theta,while oscillating with less amplitude, often followsDelta’sactivity closely.Alphasometimes follows the activity of the slower frequencies, and sometimes it’s more stable.Betais even more stable, with rare exceptions like the one at 06:29:31. AndGammabehaves the stablest, with low amplitude oscillations that may or may not be reacting to the blinking.
Stay Synced!
The purpose of SonoFields is to explore the secrets of Frequency (the Sinewave). Join the newsletter and I’ll send you some emails about:
▪ The Science: What science has been saying about brain waves and brainwave entrainment, specific frequencies like 432 Hz and 0.1 Hz, and more.
▪ The Esoteric: My ideas on geometrical and mathematical spirituality.
▪ The Practical: How to transform these ideas into practical tools.
- Getting to know EEG artifacts and how to handle them in BrainVision Analyzer (brainproducts.com) ↩︎
- https://youtu.be/04fuXQ_D_bE?si=EC8qLqMsoSFSoLKt&t=192 ↩︎ ↩︎
Sound Engineering and Research @ SonoFields