")

This page contains the data and analysis of a brain wave recording session I did using a Muse EEG Headband.
Session Characteristics
- 20/03/2024, 21:43
- I started this session doing nothing for a moments, then I started listening to music. This helps compare the effect with a before/after state.
- The music used was Blade Runner 2049 – Futuristic Psybient, Psychill, Downtempo Mix
- I spent this session with my eyes open staring into the distance, with little blinking, so signal artifacts should be minimal.
- I used active listening during the session, I was focused on the music and not thinking about other things.
- In the graphs, there will be two markers:
- M1 marks the point where I stopped being idle and started listening to the music.
- M2 marks a point where I was feeling excitement and anticipation, waiting for a part of the music that I like to kick in.
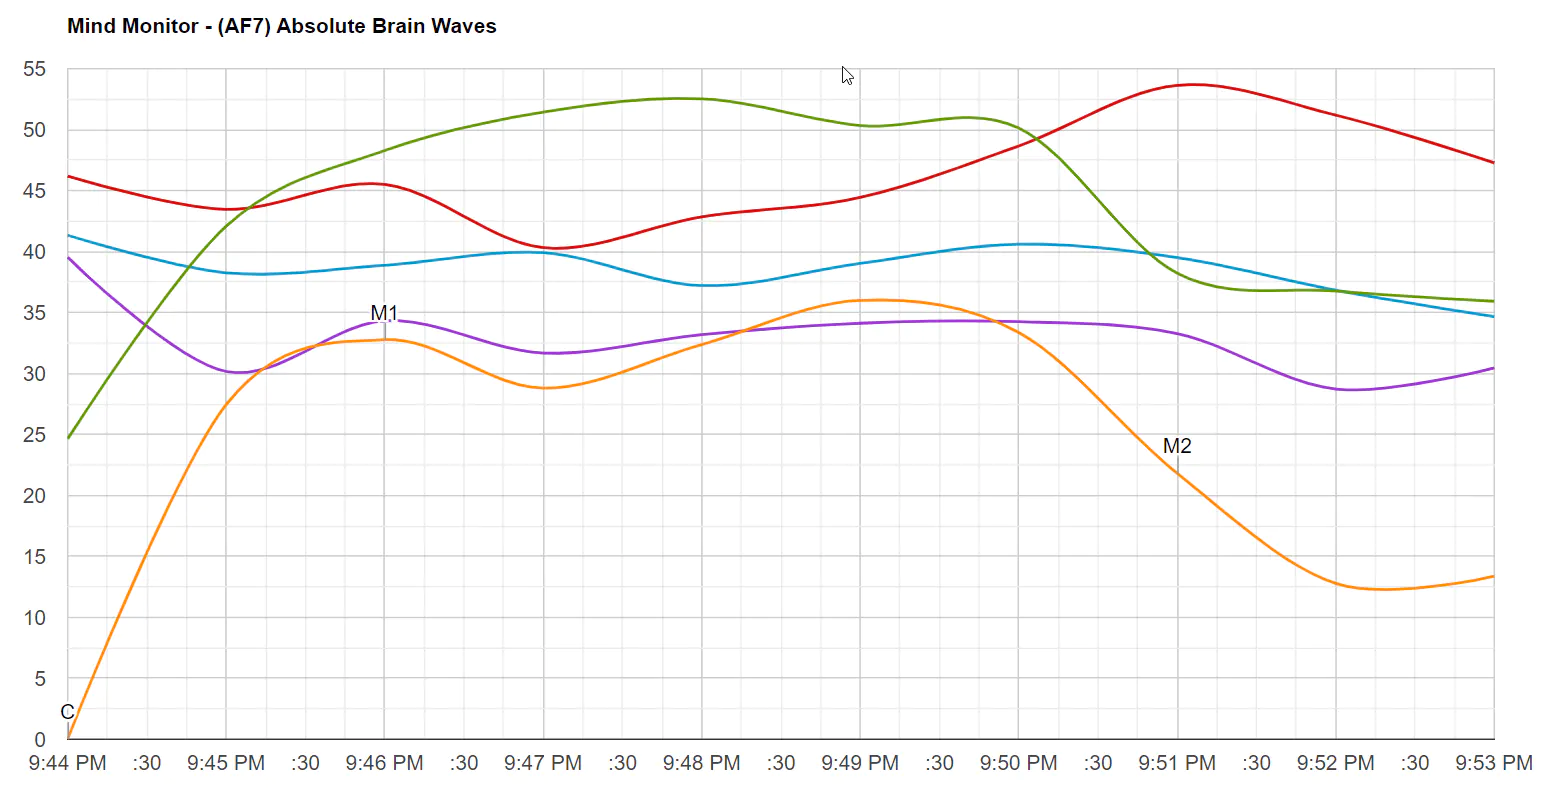
All Sensors, Smoothed Out
Looking at the smoothed out signal, some interesting things stand out immediately:
- BetaandGammaare lower during the first part of the session, when I’m idling, and remain stable at a higher level during the whole listening experience.
- Betahas second place dominance in the All Sensors graph, which is somewhat hard to achieve, based on my other recorded sessions. This means that I really was engaged during the listening experience (but as we’ll see below, not necessarily engaged in a logical way, but more in an artistic sense).
- Alpharemains stable throughout the whole session.
- The slower wavesDeltaandThetaare higher during the first part, and lower to give way toBeta,and remain constant during the listening experience.
- Gammarises in energy in correlation with my excitement and anticipation (as explained above), culminating in the M2 marker, and then falling back down again.

However, these are the average levels for all the sensors. Looking at individual sensors typically reveals even more interesting stories, so let’s take a look.
Individual Sensors, Smoothed Out
Below, we have data for four individual sensors — the Front-Left (AF7) sensor, the Front-Right (AF8) sensor, the Back-Left (TP9) sensor and the Back-Right (TP10) sensor. What can we observe?


- The most boring aspects are happening in the back sensors, with levels across all brainwaves maintaining relatively consistent levels across the entire session, with some minor exceptions.
- Beta has a fourth place of dominance in these sensors, which means that the high dominance we’ve discussed before regardingBetacan’t be coming from these sensors.
- It is common forBetaandGammato have lower places of dominance in these back sensors, even in sessions where there is mental focus and engagement. These brainwaves typically occur more strongly in the frontal lobe instead, as we’ll see next.
- In the front sensors, things are way more interesting.
- In the Front-Left (AF7) sensor, the is a large increase inBetadominance, to the point that it achieves first-place dominance during the first part of the listening experience. This is a clear sign of some sort of mental engagement, like active listening.
- CuriouslyGammahas low dominance in this sensor. I’ll return to this point shortly.
- Another curious aspect is that when M2 arrived,BetaandGammalost dominance sharply, giving way toDeltadominance instead.
- Personally, it’s always a bit hard to interpret the role ofDeltain situations not related to sleep or signal artifacts. However, this rise in dominance is not necessarily bad. It is known thatDeltaincreases can occur during mental effort and attention processes, facilitating them. This could be one such case. What is left to answer is whyBetaandGammasimultaneously decrease. I am not familiar with this pattern.
- The Front-Right (AF8) sensor is where the most interesting activity is found.
- Here, we can see that bothBetaandGammareach the highest places of dominance (first and second respectively).
- Importantly, after M2, these two frequencies do not fall sharply in dominance like in AF7, but instead increase even further!
- Based on what some brain quadrant models propose (e.g. Schroeder’s Brain-Quadrant Model), the Front-Right part of the brain is associated with creativity and artistic engagement.
- Based on my own previous sessions, I found that exclusive activity in this region has always been associated with interesting occurrences like creative insights and even mystical experiences.
- I mention the word “exclusive” precisely to convey the point that these experiences only occur when there is high activity in the Front-Right (AF8) sensor and not exactly on the Front-Left (AF7) sensor. After M2 it can be said that I entered in some sort of artistic flow state (as a listener), and that explains whyBetaandGammadropped in AF7 but increased even further in AF8.
- In the Front-Left (AF7) sensor, the is a large increase inBetadominance, to the point that it achieves first-place dominance during the first part of the listening experience. This is a clear sign of some sort of mental engagement, like active listening.
Energy Level % Changes Over Time
The graphs below show howDelta,BetaandGammachanged over time in terms of energy levels (not in dominance levels), for each of the sensors. Only these three frequencies were included because they were the only ones with the most interesting changes.

- Deltahad an increase of ≈166% in the Front-Left AF7 sensor, after M2.
- Betahad a gradual increase of energy in both front sensors, but after M2 it loses energy in the Front-Left AF7 and gains in AF8 up to 750%.
- Gammahad a gradual increase of energy in both front sensors, but after M2 it loses energy in the Front-Left AF7 and gains in AF8 up to 1250% after peaking up to 2000% (that’s very likely the exact moment when my favorite music kicked in).
Lateral and Antero-Posterior Distribution Over Time
Let’s analyze howDelta,BetaandGammaenergy levels changed over time across the four brain quadrants.
The image below shows us, from left to right, howDelta:

- Deltabegan more or less balanced in the Front part of the brain, but with a gradual tendency to the Front-Left (AF7) up until M2, where the energy levels then quickly rose to 3x more than in Right-Front AF8, making the tendency more pronounced.
- As I said before, I don’t really know how to interpret with confidence this kind ofDeltaactivity, but I’ll leave the graphs here in case I come across with similar patterns in the future.
The image below shows us, from left to right, howBeta:

- In the Right-Hemisphere, during the beginning of the session,Betahad low energy levels in the Front-Right (AF8), resulting in a dominance in the Back (TP10), which is something very normal in most circumstances. Then those levels rose when the music started playing, gradually shifting the dominance to Front (AF8) in a maximal 4:1 ratio.
- In the Left-Hemisphere,Betastarted with lower energy in Front (AF7), creating a normal dominance in the Back (TP9). When the music started, and I began doing active listening, those levels rose, shifting the dominance to the Front (AF7). After M2, those levels dropped once again, returning the dominance to the Back (TP9) again.
- In the Pre-Frontal Cortex (AF7, AF8),Beta started with similar levels of energy in AF7 and AF8. When the music started, and I practicing active listening, Betarose in both sensors, but slightly more in Right (AF8), shifting the dominance there in to a 1.5:1 ratio. After M2, Betadropped in AF7, and the dominance became even more pronounced, resulting in a 4:1 dominance ratio in favor of AF8.
The image below shows us, from left to right, how Gamma:

- In the Posterior Cortex (TP9, TP10),Gammaspent most of the session with a tendency to the Left (TP9), but after M2 there was a shift to the Right (TP10).
- In the Left-Hemisphere,Gammastarted with lower energy in Front (AF7), creating a normal dominance in the Back (TP9). Then those levels rose, shifting the dominance to the Front (AF7). UnlinkeBeta,this shift happened even before the music started, and I’m not sure why. In any case, the pattern is broadly the same. And after M2, those levels dropped once again, returning the dominance to the Back (TP9) again.
- In the Pre-Frontal Cortex (AF7, AF8), Gammastarted with similar levels of energy in AF7 and AF8. But it quickly shifted slightly to the Right (AF8). That’s because, even thoughGammarose in both sensors, it rose 1.5x more on the Right (AF8). After M2, Gammadropped in AF7, and the dominance became even more pronounced, resulting in a 5:1 dominance ratio in favor of AF8.
I understand this analysis might be getting a bit complicated. So, in a few sentences, what is my big takeaway from the graphs?
During the first part of the music, I was both engaged intellectually with what I was hearing, but also simply enjoying it as a listener who enjoys the art. Therefore, there were high energy levels ofBetaandGammain the Front-Left (AF7) and Front-Right (AF8) quadrants. However, when my favourite music started playing, I stopped the intellectual approach and entered in some sort of flow state as a listener. That’s why the energy levels in Left-Front (AF7) dropped and the energy levels in Right-Front (AF8) increased even further.
Right-Back Sensor (TP10)
Let’s look at TP10, non-smootthed out, as a side note.
In some of my sessions, I analyze my EEG data generated when I was listening to some advanced brainwave entrainment tracks, and there I found unusual brainwave activity in TP10. You can read about that in any of these sessions: Session 19, Session 21, Session 24, Session 25, Session 27, and Session 30.
The big takeaway is this: on those sessions, it was found that listening to brainwave entrainment tracks resulted in a stable, coherent, sinusoidal-like activity betweenBetaandGammawaves, in the TP10 sensor (this is a big deal, by the way, you should definitely go read more about those sessions).
But a question remained — was that activity exclusive to brainwave entrainment tracks? Or was that phenomenon observed in other instances that involved listening to audio that’s rhythmical and structured (i.e. music in general)?
Looking at the graph below, there is no evidence for such type of activity, so we can conclude that there is indeed something special about brainwave entrainment tracks.
End of side note.

Quadrant Energy Levels (Overview)
Centers of Gravity (Overview)

For reference: the circle with the black circumference marks the central area of the brain. Activity inside it is more central and symmetrical; outside is more asymmetrical.
Stay Synced!
The purpose of SonoFields is to explore the secrets of Frequency (the Sinewave). Join the newsletter and I’ll send you some emails about:
▪ The Science: What science has been saying about brain waves and brainwave entrainment, specific frequencies like 432 Hz and 0.1 Hz, and more.
▪ The Esoteric: My ideas on geometrical and mathematical spirituality.
▪ The Practical: How to transform these ideas into practical tools.
Sound Engineering and Research @ SonoFields