")
This page contains the data and analysis of a brain wave recording session I did using a Muse EEG Headband.
Session Characteristics
- 09/11/2023, 13:17
- During this session, I was testing an advanced Theta isochronic tones track I created.
- I was listening to the track with my eyes open.
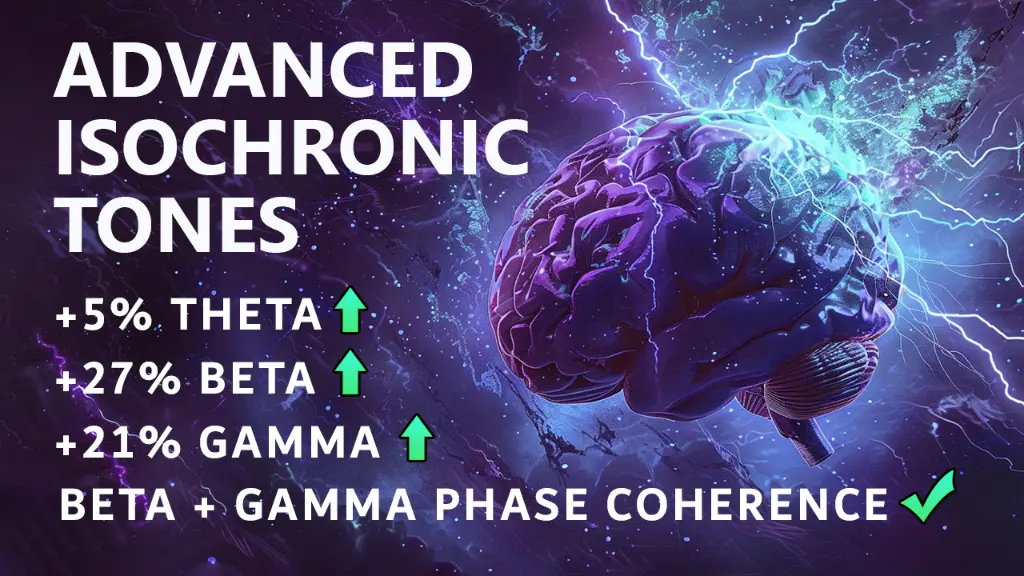
Key Findings
- +5% ThetaDominance
- + 27% BetaDominance
- + 21% GammaDominance
- Beta+ GammaBrainwave Phase Coherence
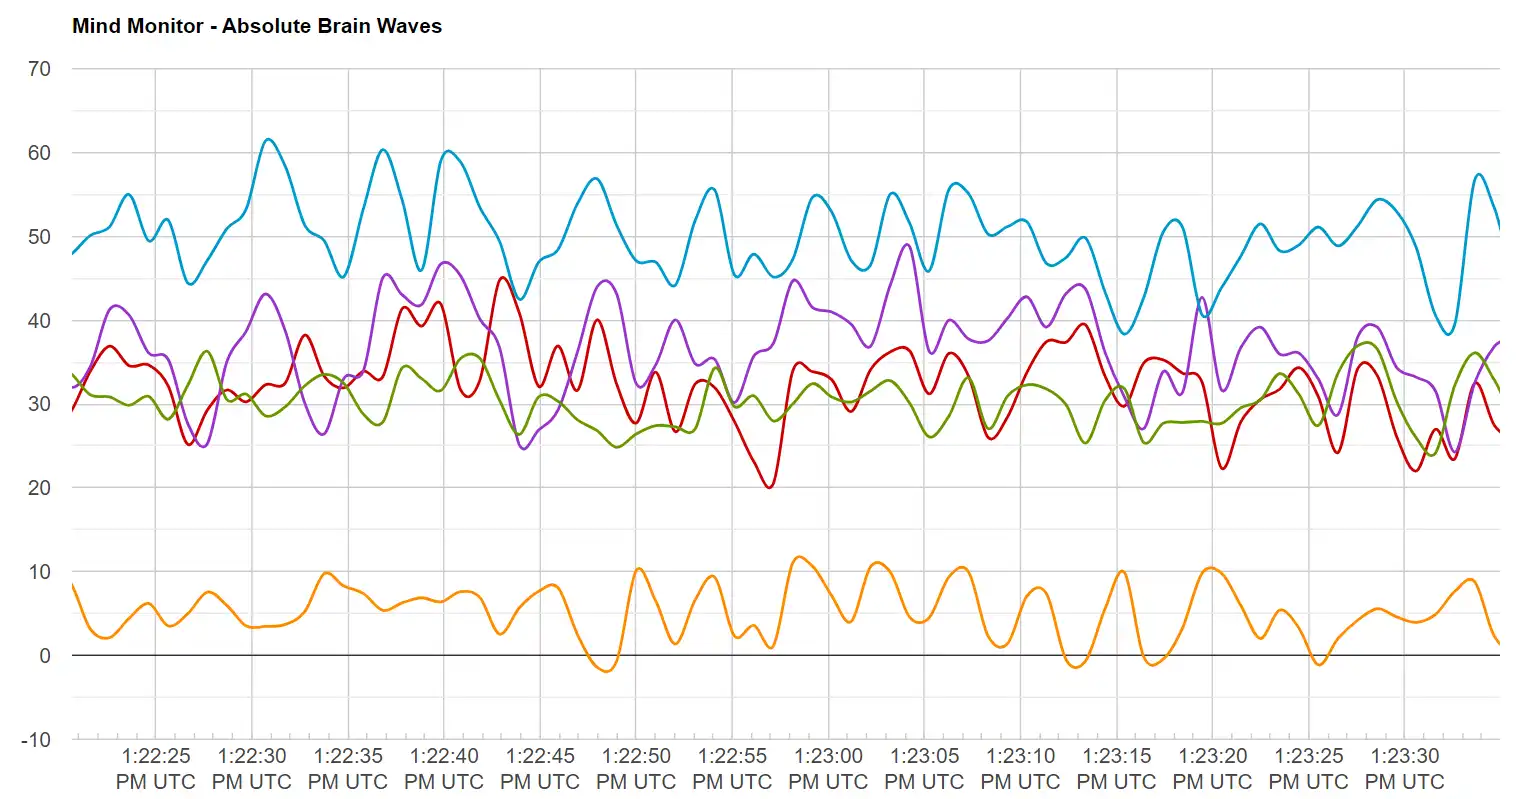
All Sensors
- Looking at the data from all sensors, we can see thatAlphadominated, followed by a band comprised ofTheta,Delta,andBeta,and then finally a lower isolatedGammaband.
- There is an overall reduction of energy levels across all frequencies, over time,
- Zooming in for more clarity, we can see thatThetahas second-place dominance across most of the session. I don’t consider this to be the result of entrainment, and instead be simply the result of my being in a relaxed, idling state.
- Let’s keep searching for other entrainment markers.
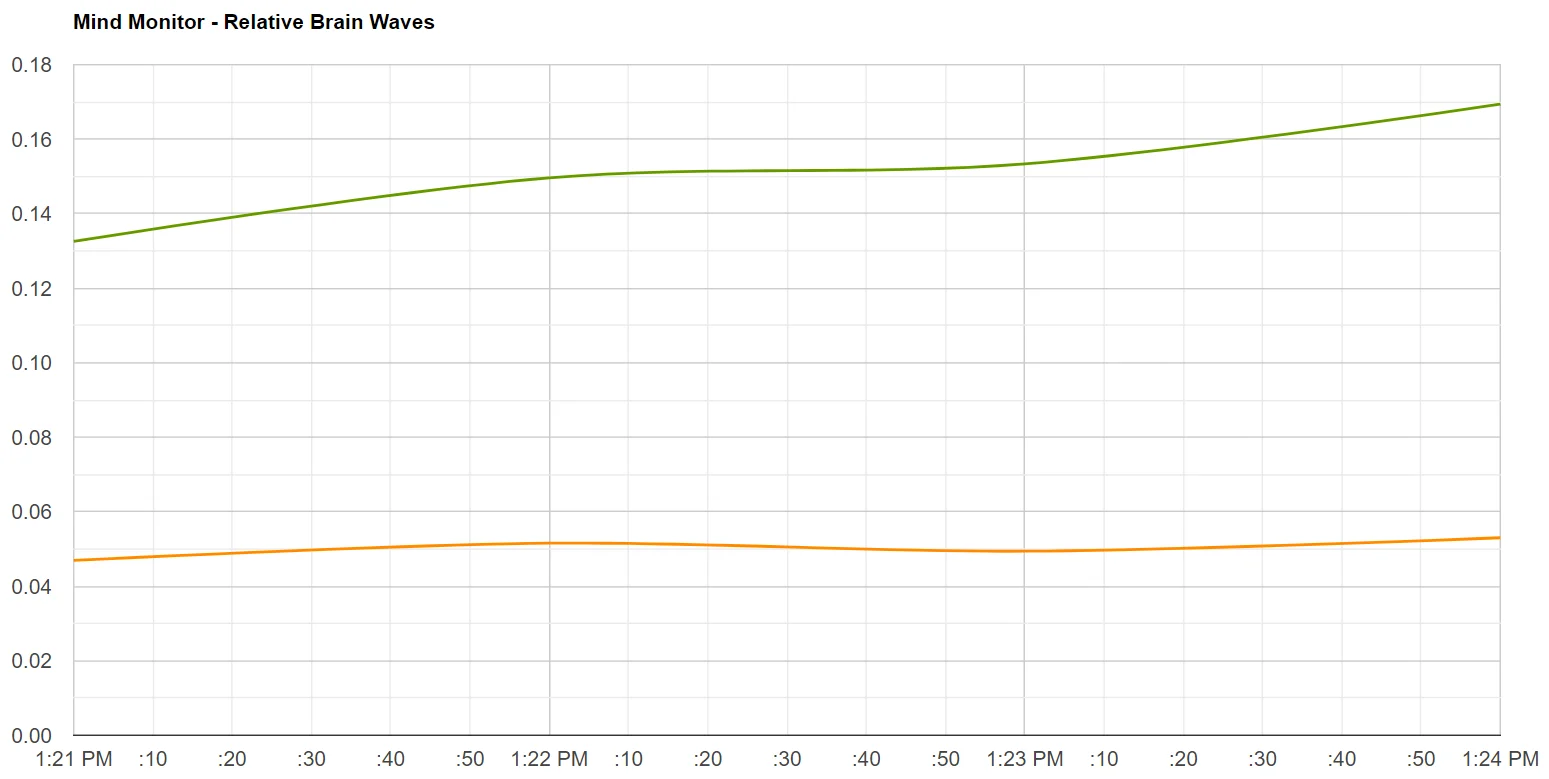
How Did Dominance Percentages Change Over Time?
The graphs shown below show how dominant frequencies were across the session, in %.
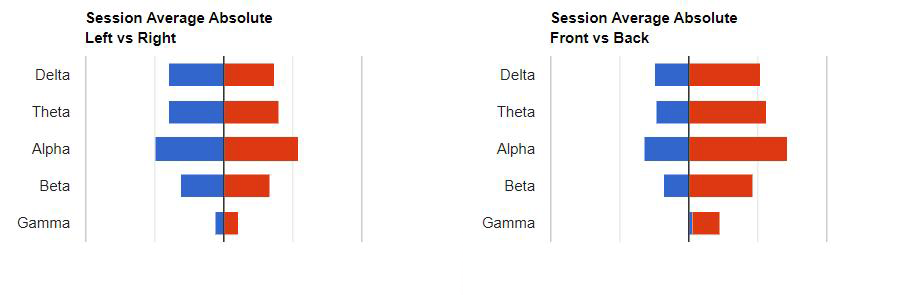
- BetaandGammahad a slight increase in dominance across all brain quadrants. Averaging the data from all sensors we can say that:
- Betawent from 13.3% to 16.9% dominance, corresponding to a 27% increase.
- Gammawent from 4.7% to 5.7% dominance, corresponding to a 21% increase.
- Deltadecreased in dominance across all brain quadrants, averaging about -24%.
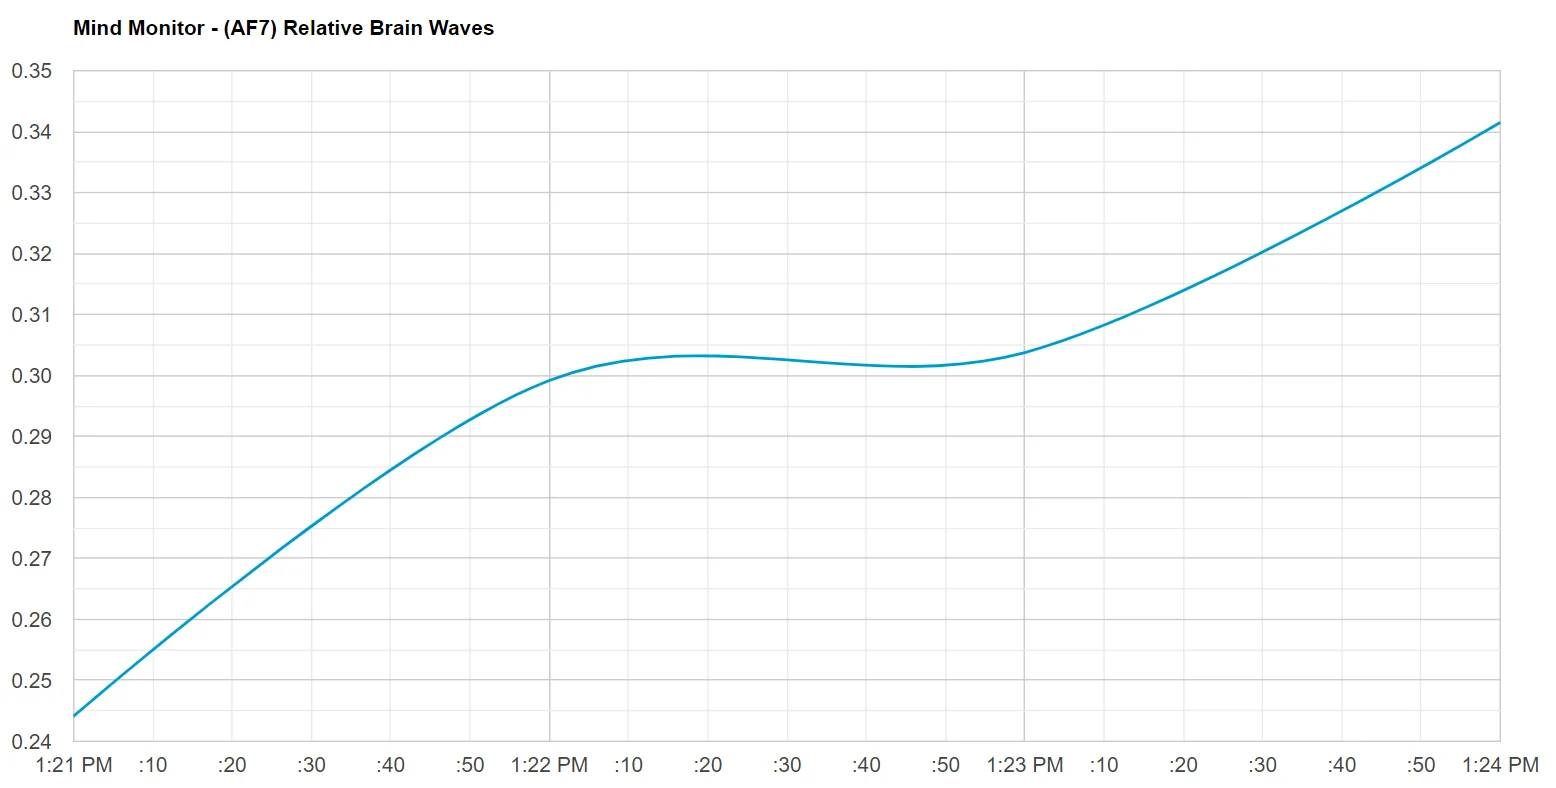
- Alphahad a slight decrease in dominance of about -7% in all sensors except in the Front-Left (AF7), where it had a 40% increase.
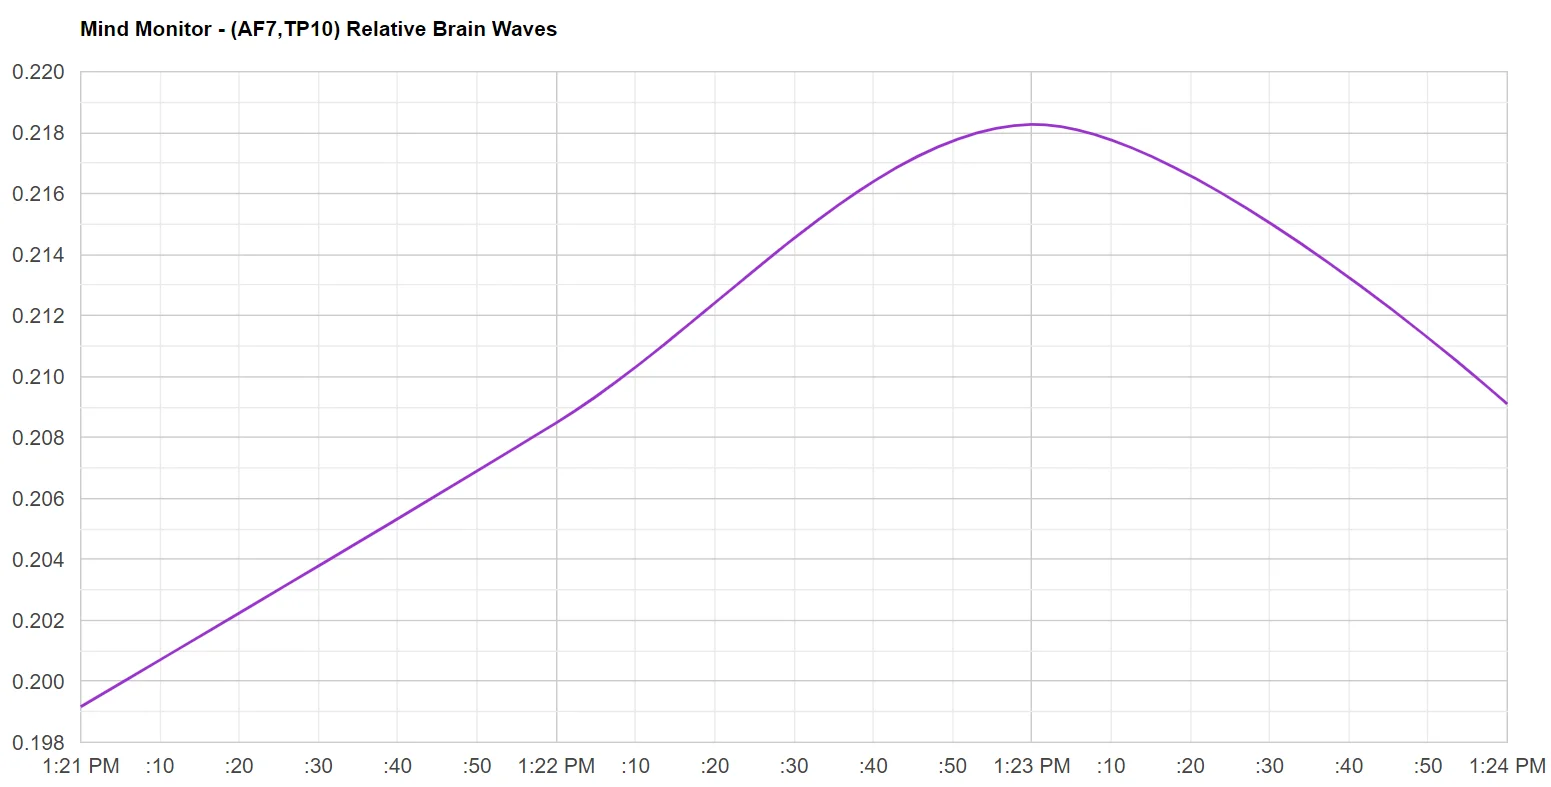
- Thetahad a very slight dominance increase of 5% in the Front-Left (AF7) and Right-Back (TP10) sensors, and remained stable in the other two.
- Plenty otherThetaentrainment tracks I’ve analyzed have resulted in more interesting changes in dominance. However, this doesn’t mean this track wasn’t able to entrain the brain. Let’s take a look at the next section.
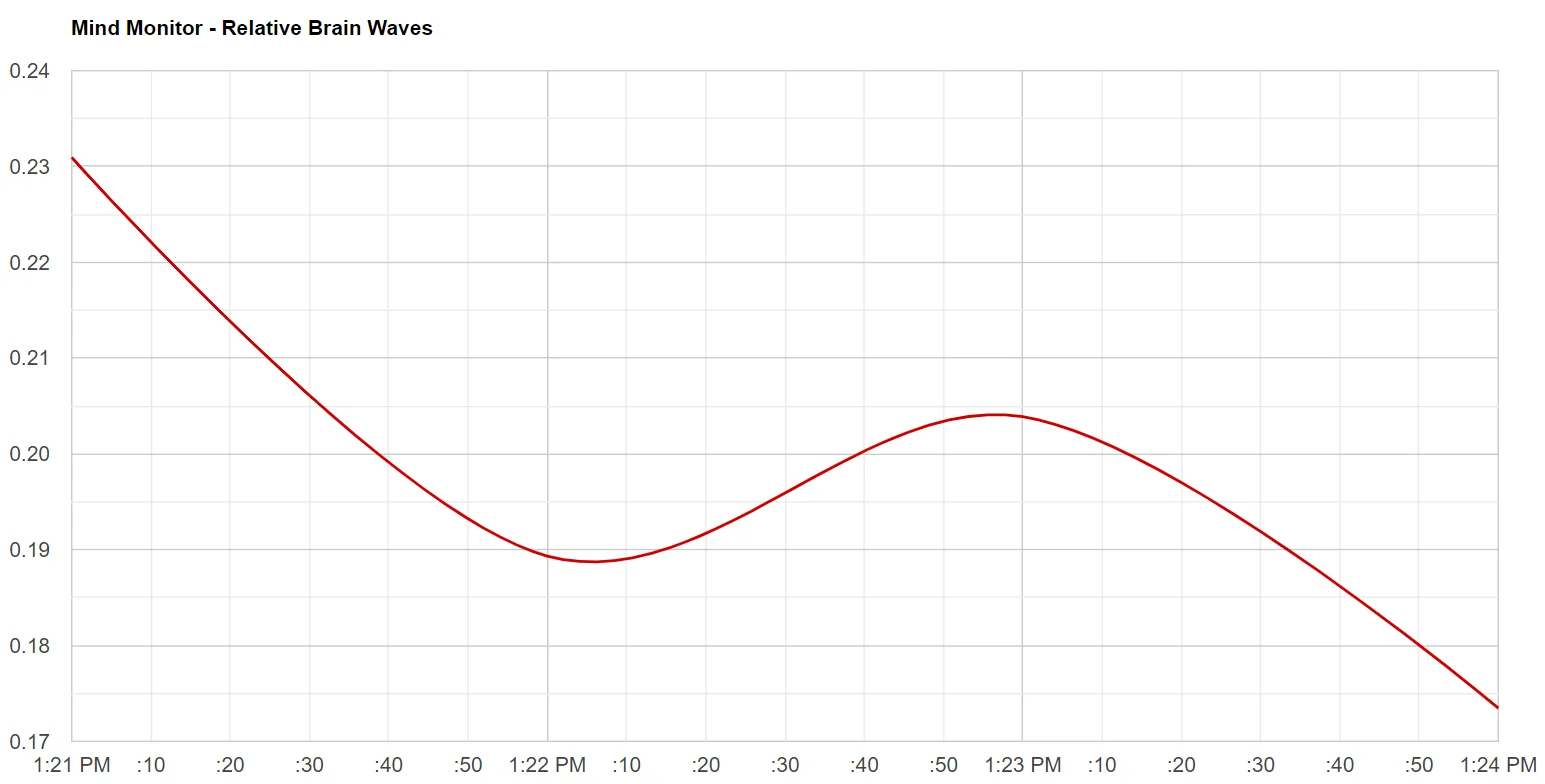
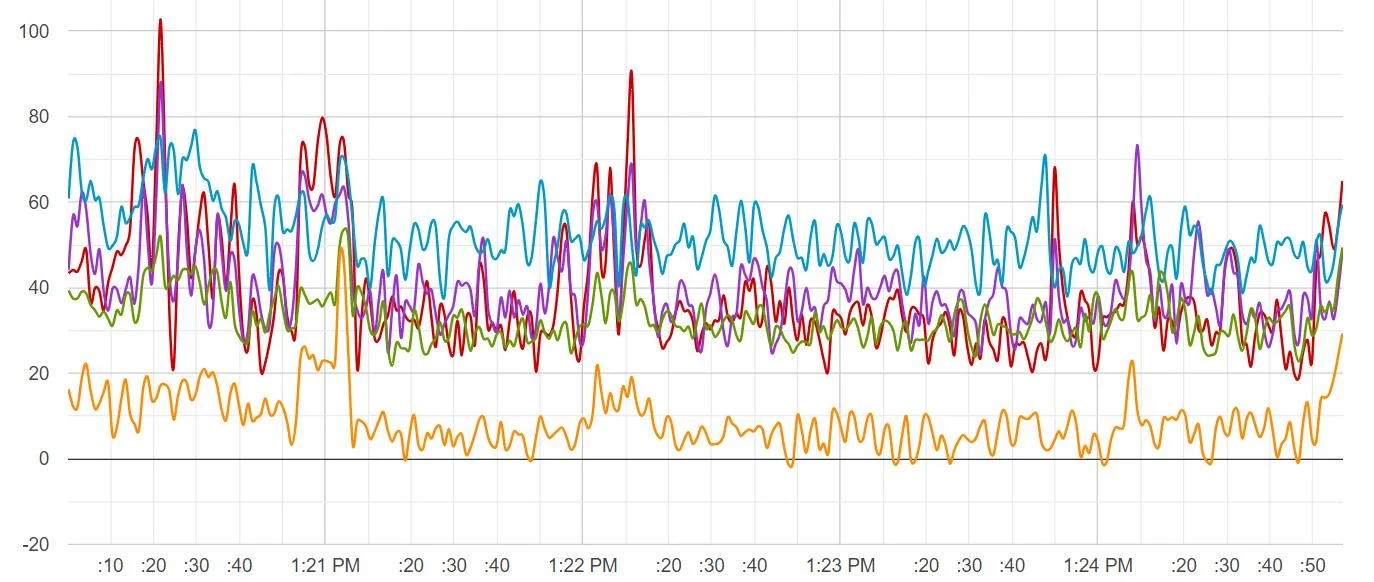
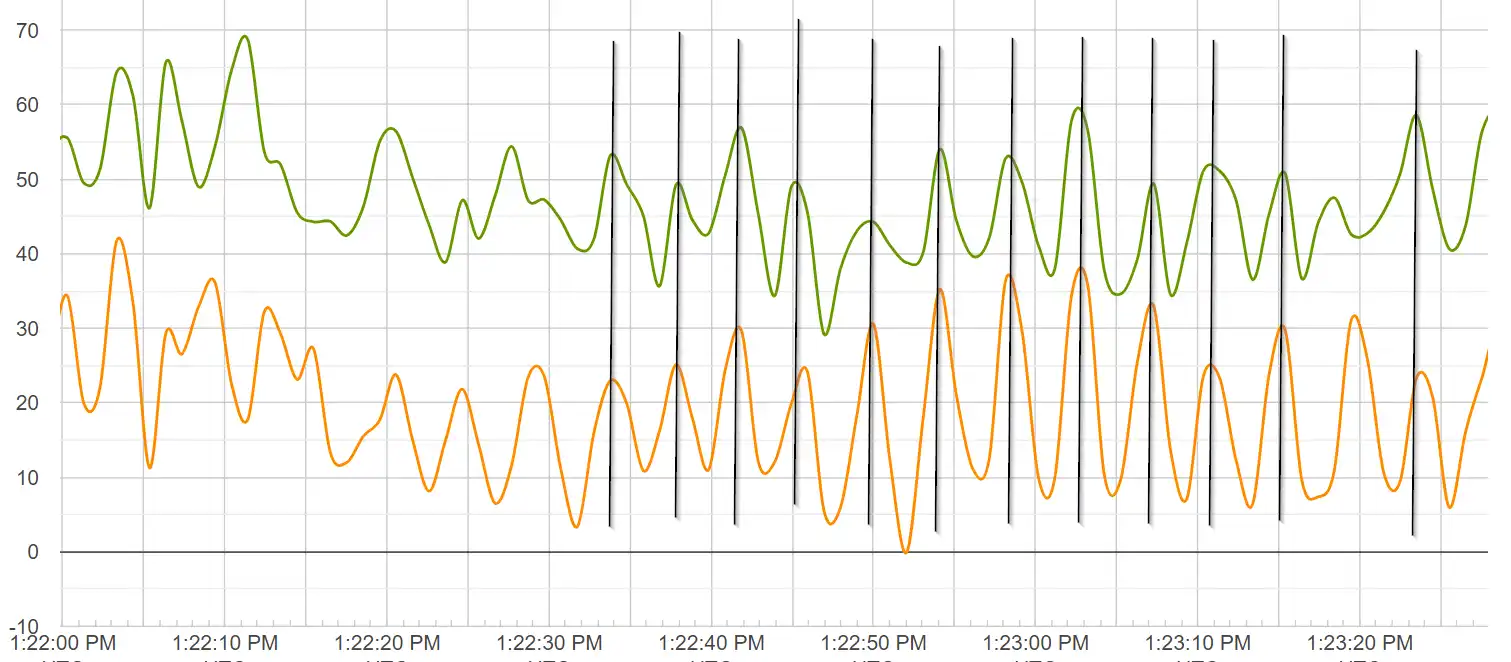
Right-Back Sensor (TP10)
- Looking at the Right-Back quadrant, a clear sign of entrainment is found ✅
- I’m referring to the behavior of theGammafrequency range — an oscillating sinusoidal pattern with sustained and consistent peaks and valleys.
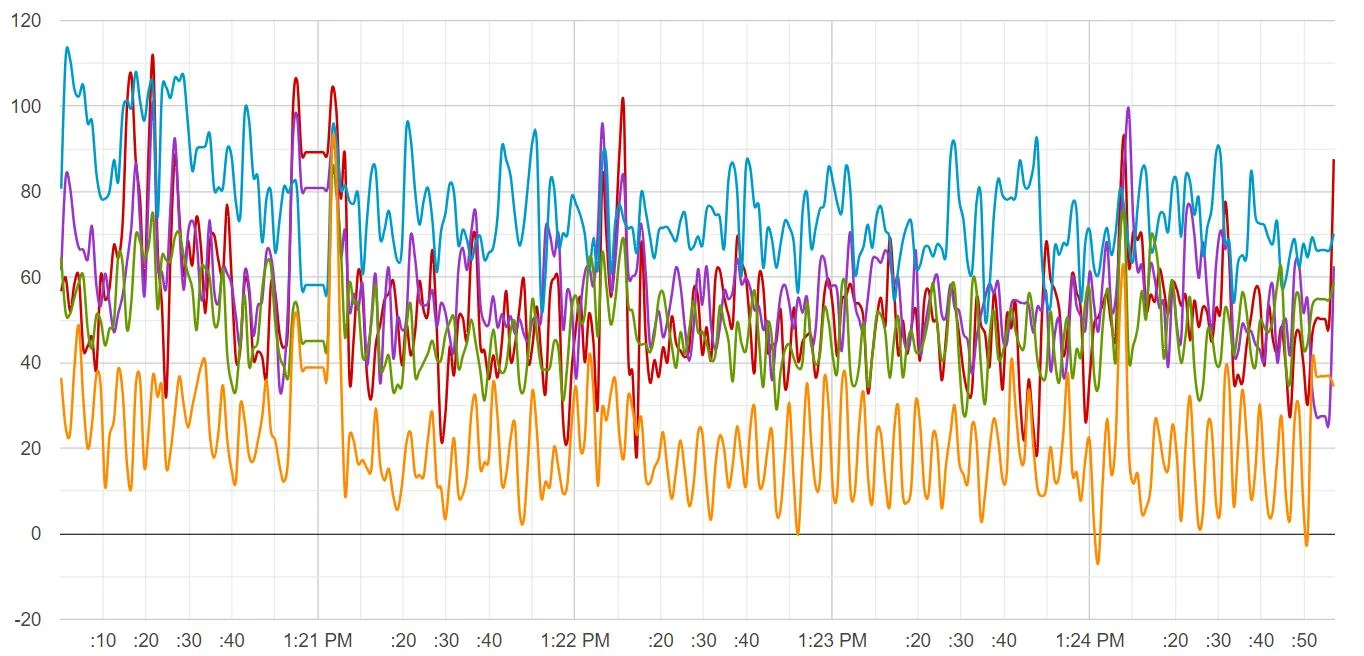
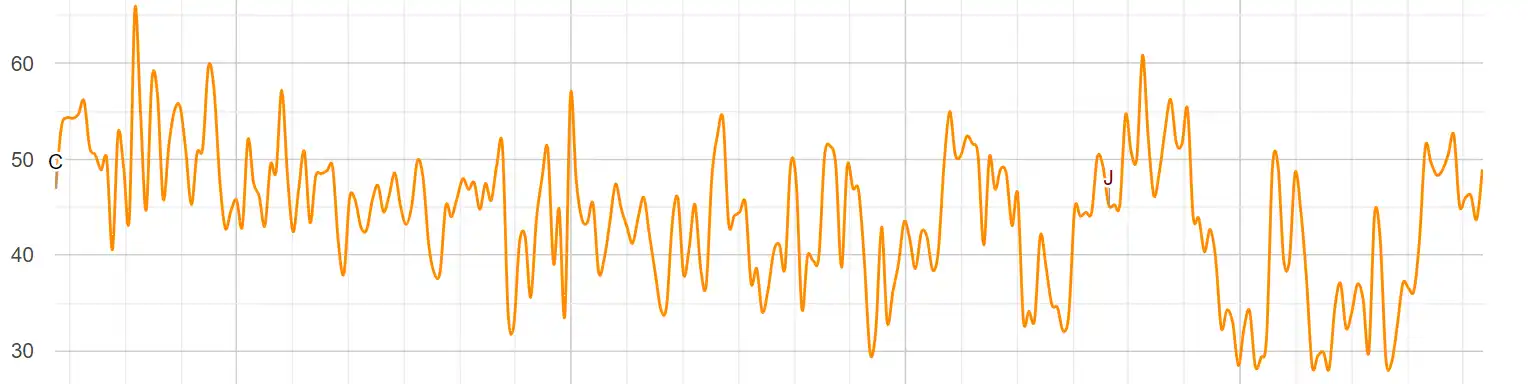
- This type of orderly behavior has never been observed in any other session that doesn’t involve brainwave entrainment. For reference, below is an image showing what typicalGammabehavior looks like. Simply put, it looks much more unpredictable and chaotic.
- If we look even closer at the brainwaves, we see thatBetaalso seems to be showing signs of entrainment in the TP10 sensor, in a way that is synchronized withGamma.
Quadrant Energy Levels (Overview)
Centers of Gravity (Overview)
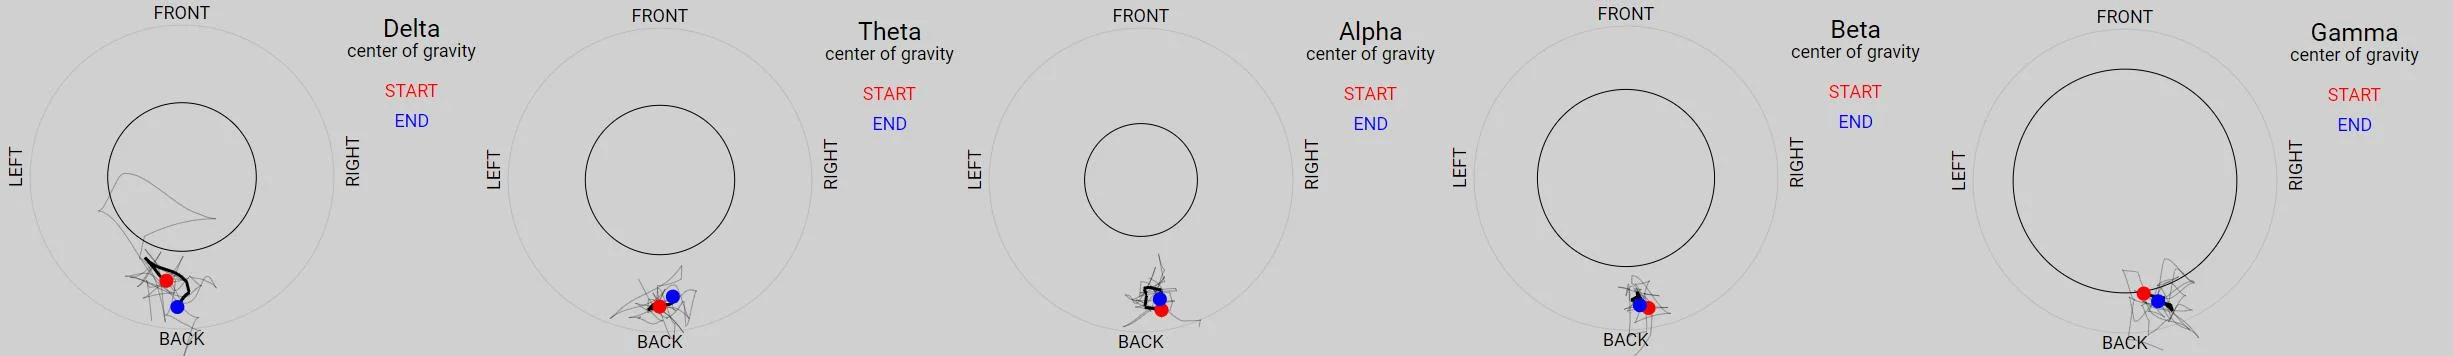
For reference: the circle with the black circumference marks the central area of the brain. Activity inside it is more central and symmetrical; outside is more asymmetrical.
Get This Track
If you are interested in trying this track, you can get it as part of the NEX: Brainwave Entrainment Bundle
Stay Synced!
The purpose of SonoFields is to explore the secrets of Frequency (the Sinewave). Join the newsletter and I’ll send you some emails about:
▪ The Science: What science has been saying about brain waves and brainwave entrainment, specific frequencies like 432 Hz and 0.1 Hz, and more.
▪ The Esoteric: My ideas on geometrical and mathematical spirituality.
▪ The Practical: How to transform these ideas into practical tools.
Sound Engineering and Research @ SonoFields