")
This page contains the data and analysis of a brain wave recording session I did using a Muse EEG Headband.
Session Characteristics
- 02/11/2023, 16:52
- During this session, I was playing a 9×9 Sudoku game on paper.
- In the middle of it, I got a bit sleepy.
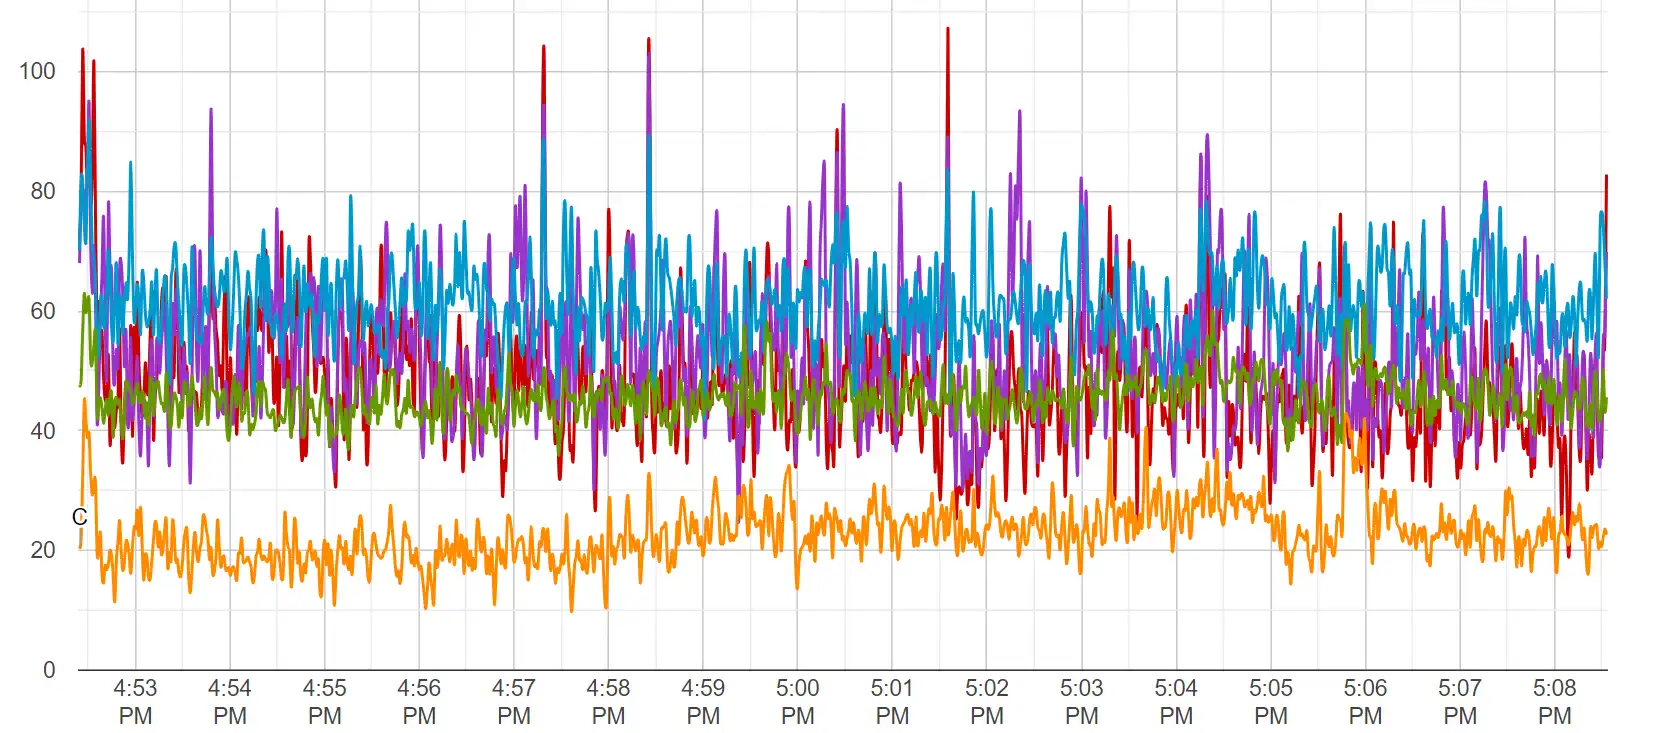
All Sensors
- Even though looking at the data as is shown below is not very clear, we can still discern that:
- Gammahas the lowest dominance throughout the whole session, and it’s separated into its own territory.
- Over time,Gammaincreases in energy, while other frequencies remain more stable.
- For a clearer picture let’s smooth out this activity.
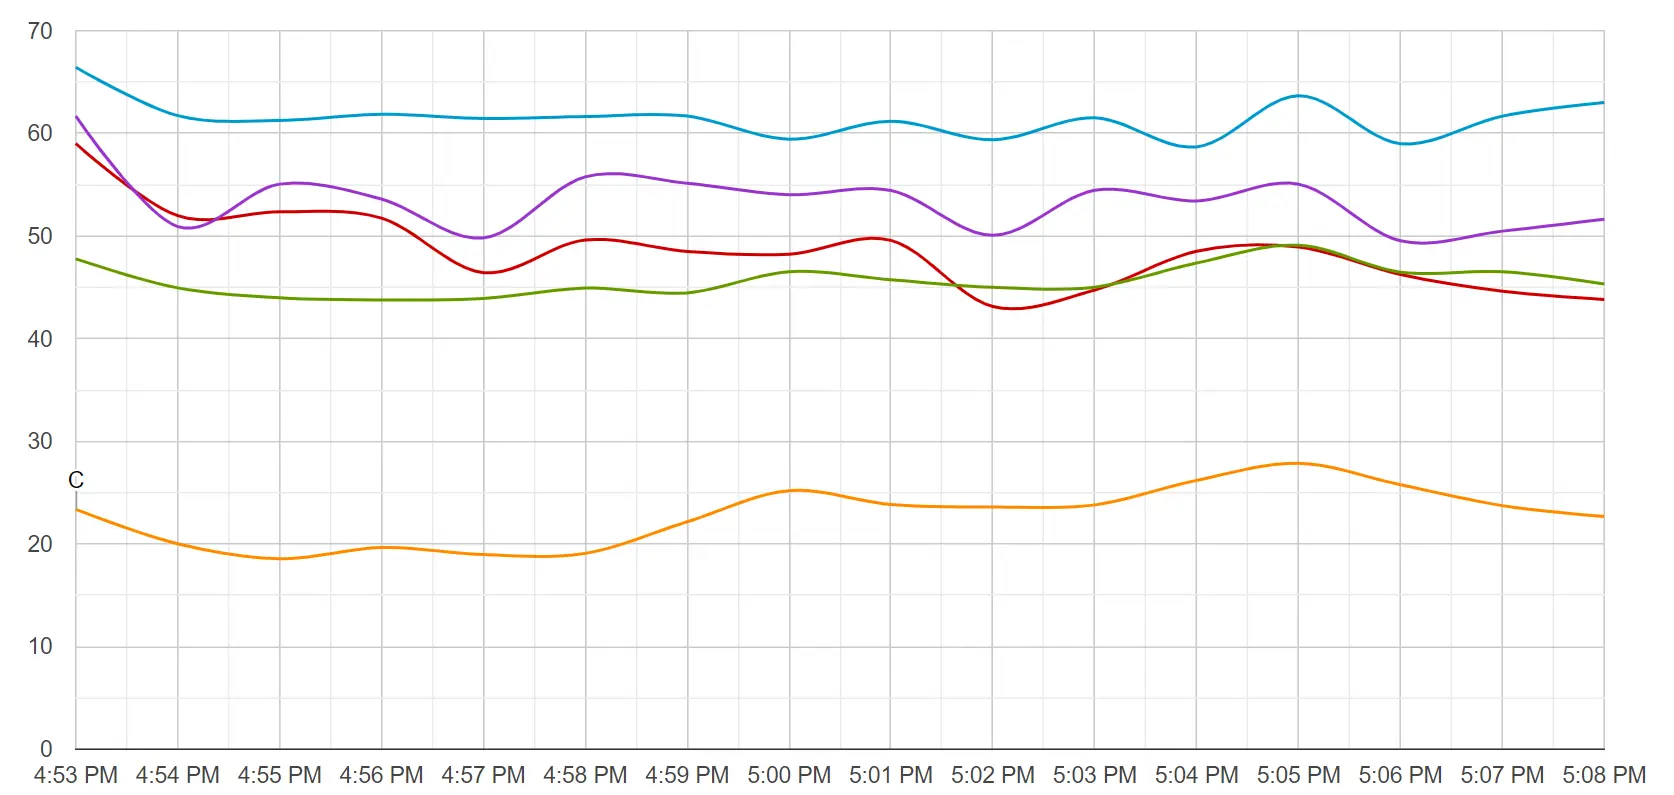
All Sensors (Smoothed Out)
- Smoothing out the frequency bands confirms what was mentioned in the previous section.
- GammaandBetaremain in lower dominance throughout the whole session, which seems to be unexpected since this session supposedly required some brain effort.
- However, since I mentioned I felt a bit sleepy during the middle of the session, that indicates that I was performing this task in a relaxed state. The nature of Sudoku does not require super-focused attention under a chronometer (like Session 12) so it’s possible to complete that activity while being more relaxed, which might explain the graphs we’re observing.
- Still, looking at the sensor data from all sensors rarely tells the whole story, so next we’ll look into individual sensor data.
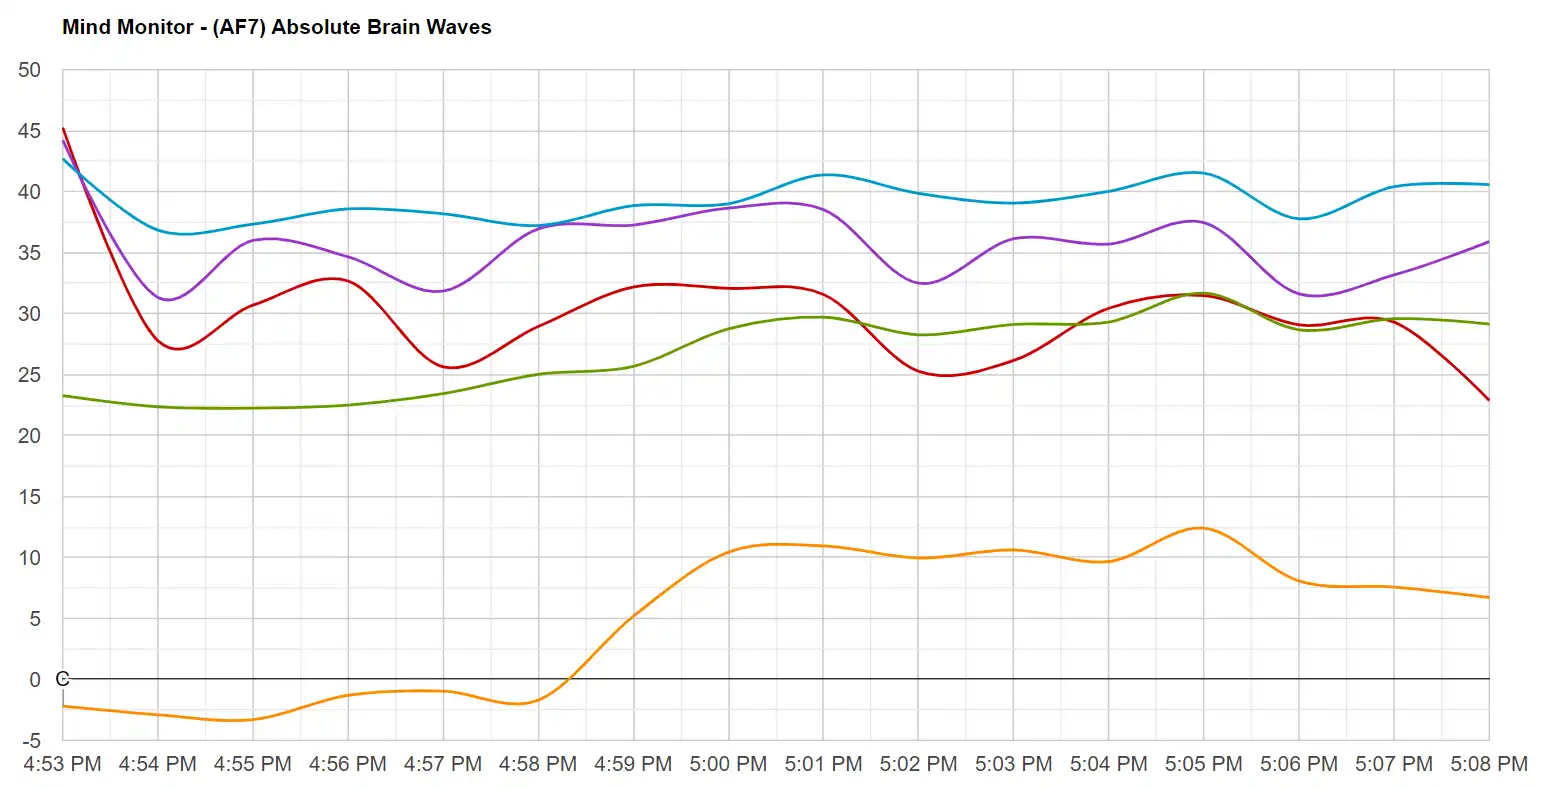
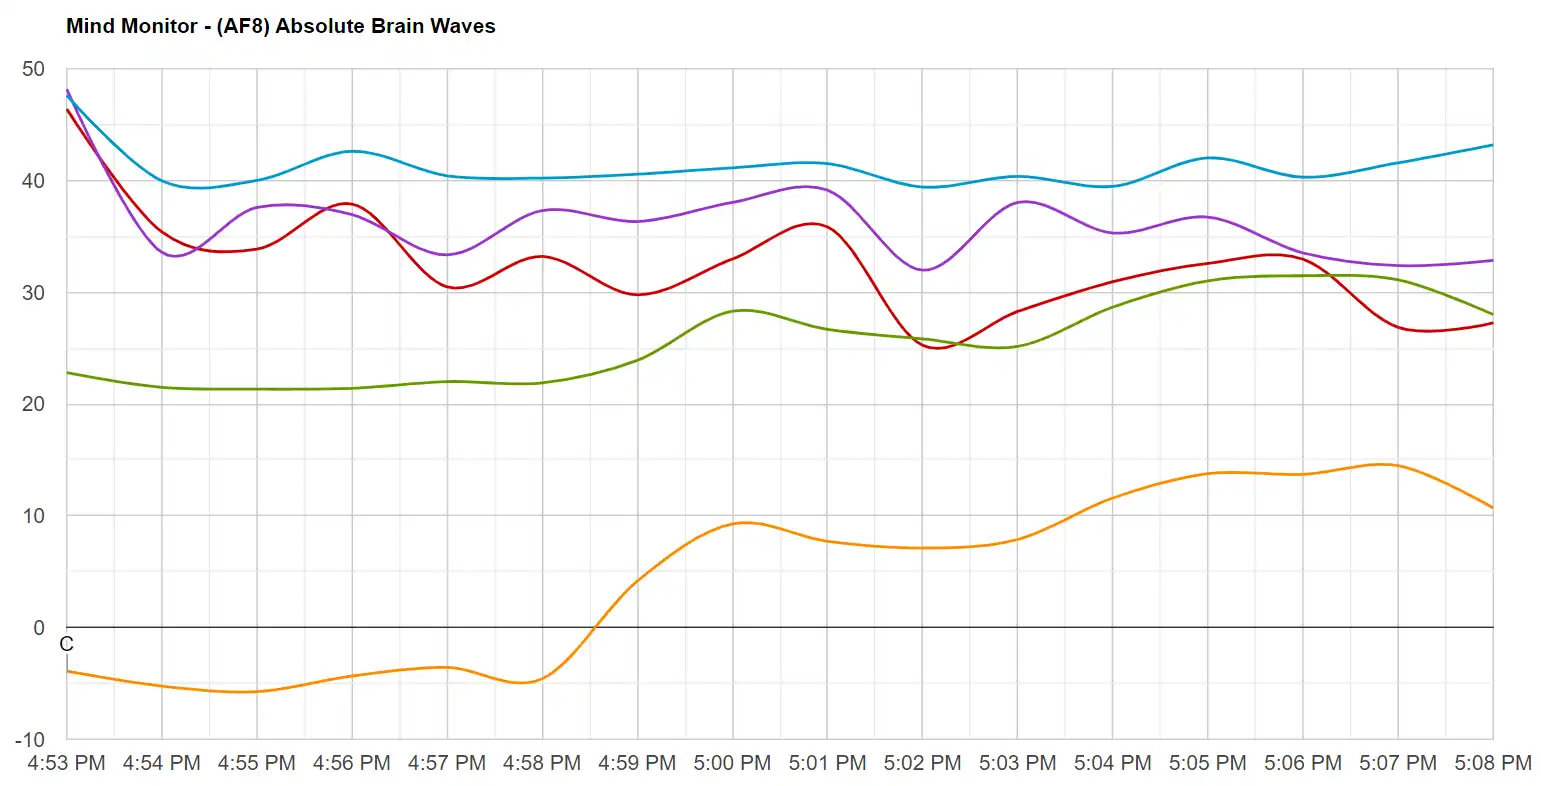
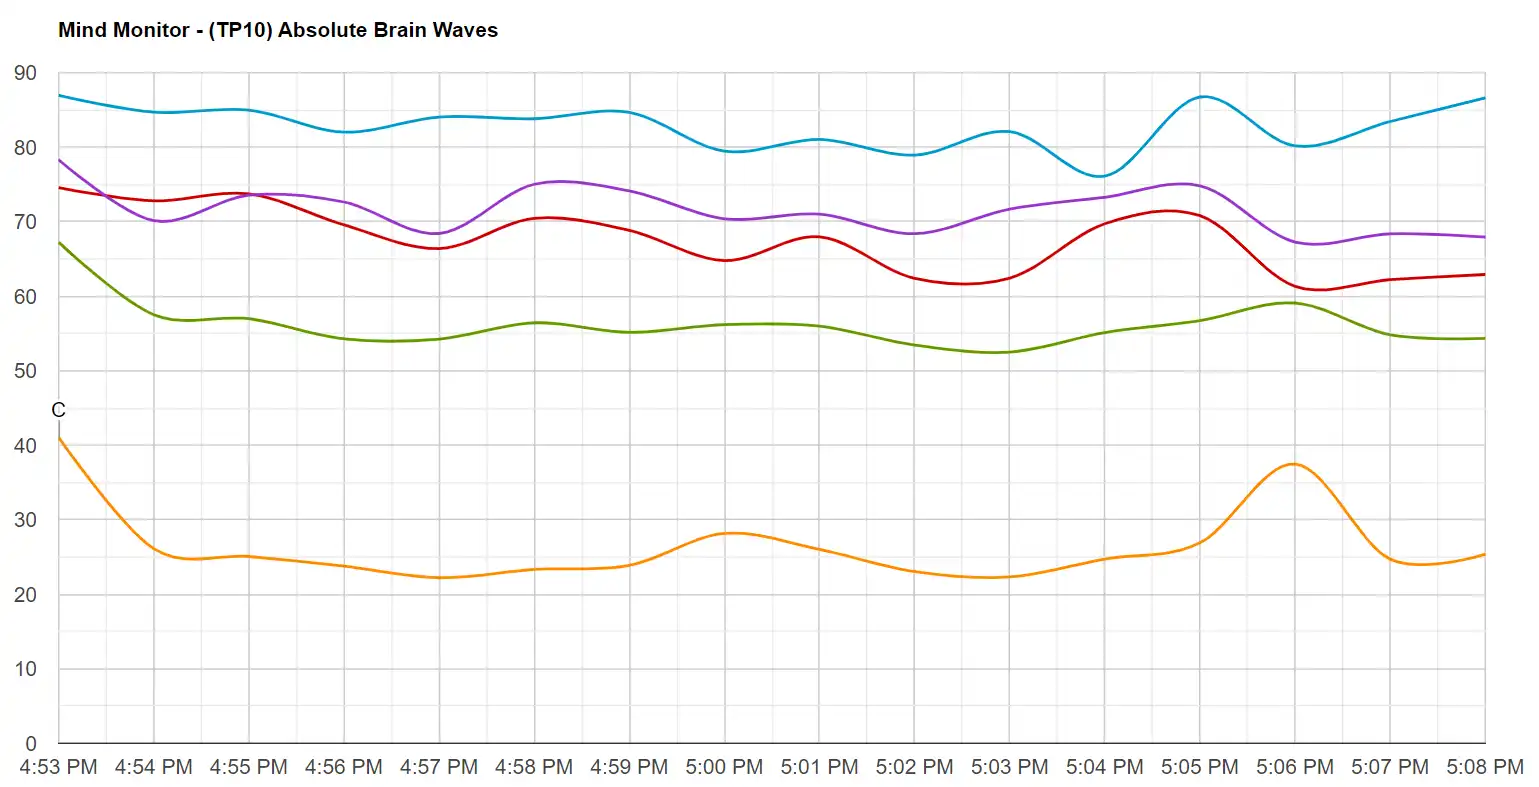
AF7, AF8 and TP10 Sensors (Smoothed Out)
- Looking at the Front-Left (AF7), Front-Right (AF8), and Back-Right (TP10) sensors, we detect, overall, the same pattern.
- HighAlphadominance and lowBetaandGammadominance in all those quadrants seem to show that there is not much activation happening there.
Left-Back Sensor (TP9)
- The only sensor left to analyze is the Left-Back (TP9).
- We must find some form of higher activation in this part of the brain, otherwise, you probably won’t even believe I was able to solve the Sudoku game.
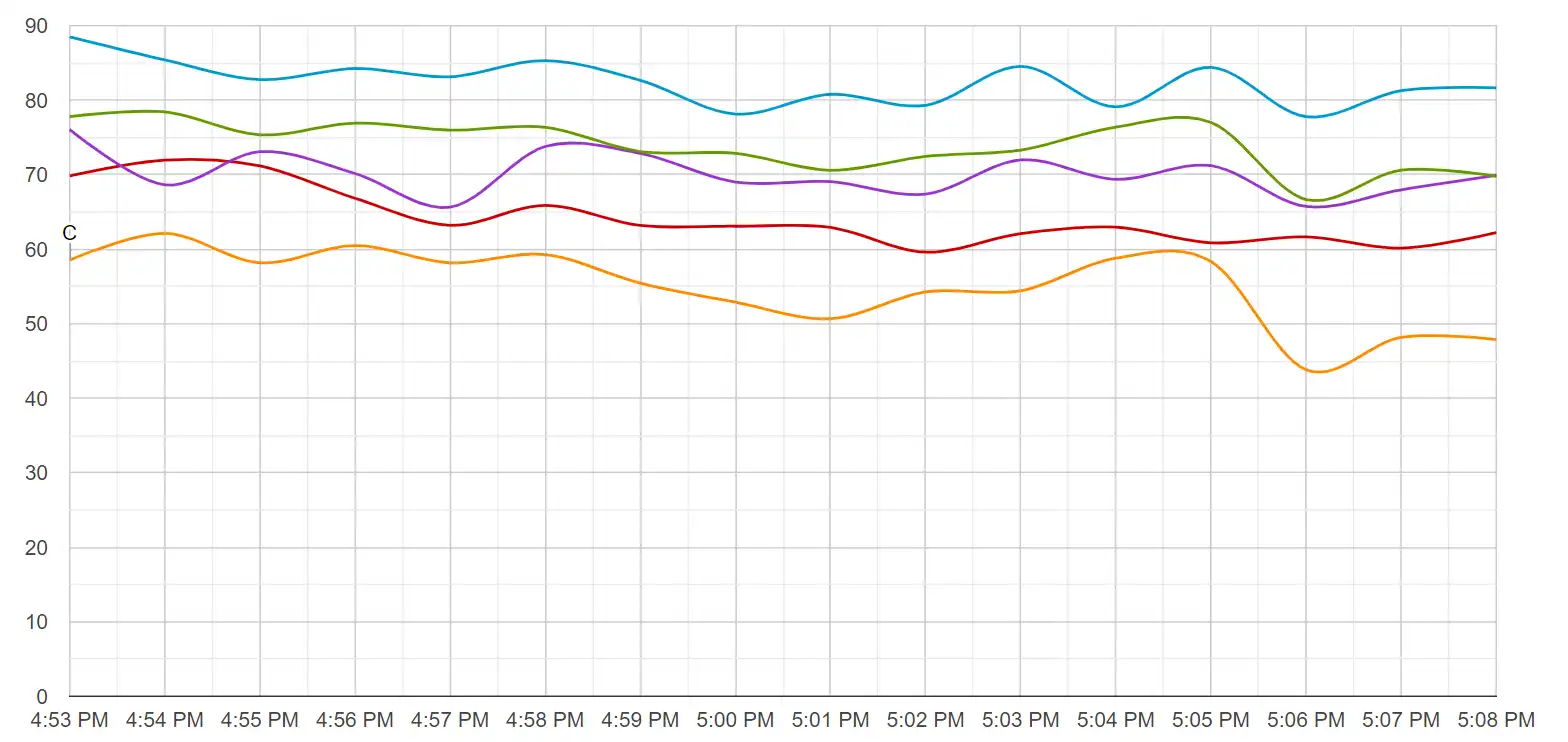
- And indeed that is what is observed in the graph above! ✅
- WhileAlphais still dominant,Betaclearly takes the second lead in dominance, andGamma,even though it’s still the lowest dominant range, is much higher than in other quadrants, and helps form a tighter band comprised of all five frequencies.
- This indicates that the brain power used for solving Sudoku was located mainly in the Left-Back quadrant. This is similar to Session 12.
However, to be fair, it is also true that while not the most dominant frequencies there, Betaand Gammastill had a constant and gradual increase in energy in the front AF7 and AF8 sensors.
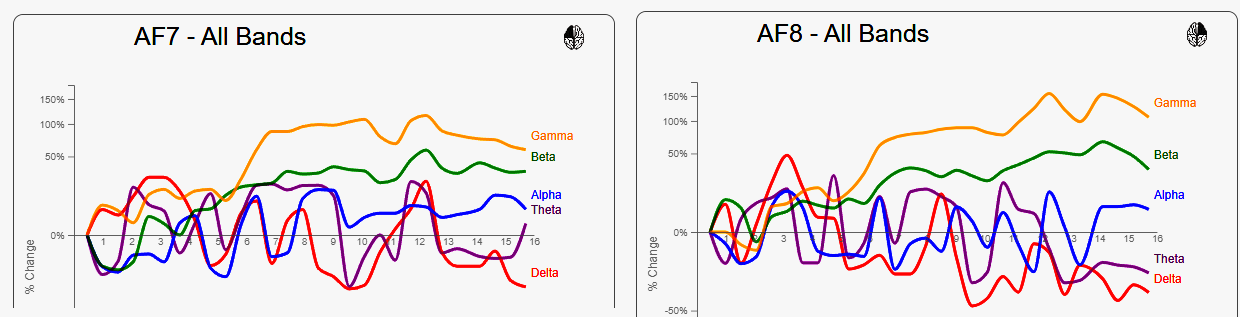
In terms of percentages, these two frequencies had a proper increase, up to 50% and 100% respectively. I’d say this is a result of my brain effort, but let’s not let the graph above fool us into thinking they were very dominant in those areas — the truth is, they were still the least dominant frequencies in AF7 and AF8. The really impressive and most interesting aspect of the session for me was, without a doubt, what happened in TP9.
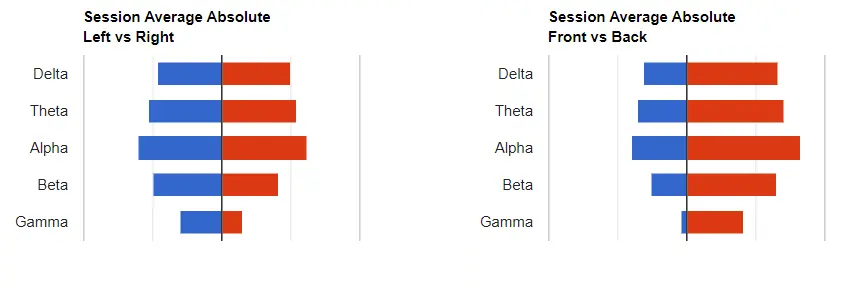
Quadrant Energy Levels (Overview)
Centers of Gravity (Overview)
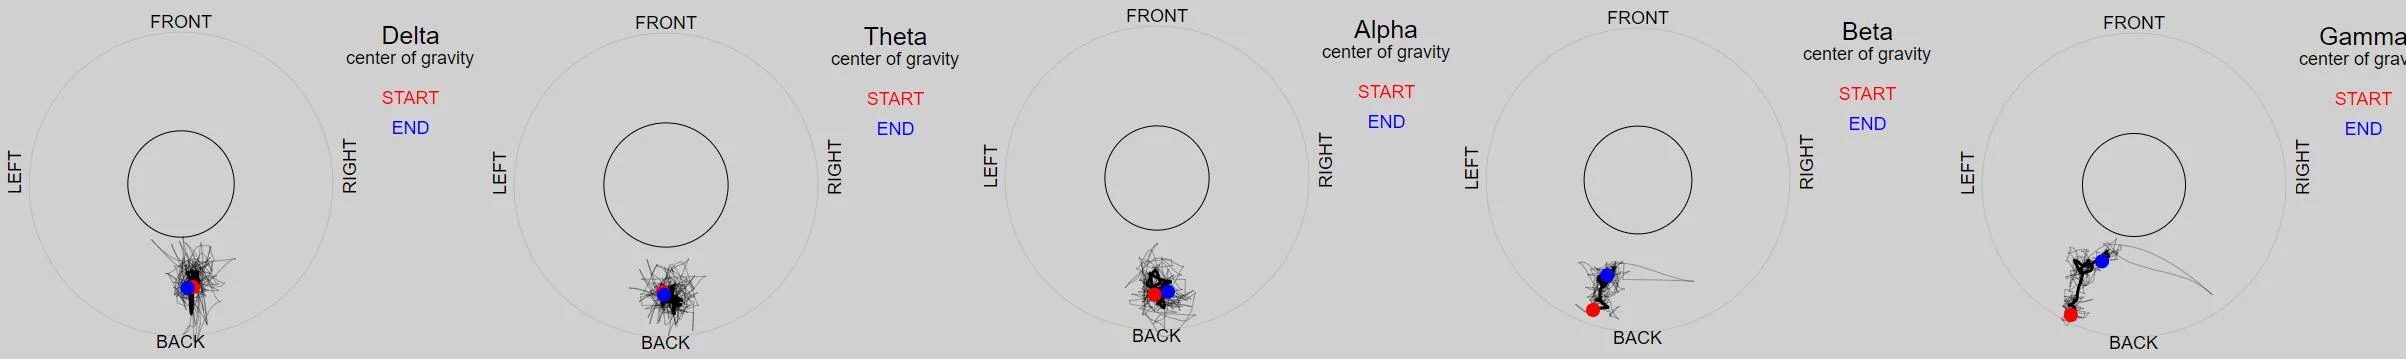
For reference: the circle marks the central area of the brain. Activity inside it is more central and symmetrical; outside is more asymmetrical.
Stay Synced!
The purpose of SonoFields is to explore the secrets of Frequency (the Sinewave). Join the newsletter and I’ll send you some emails about:
▪ The Science: What science has been saying about brain waves and brainwave entrainment, specific frequencies like 432 Hz and 0.1 Hz, and more.
▪ The Esoteric: My ideas on geometrical and mathematical spirituality.
▪ The Practical: How to transform these ideas into practical tools.
Sound Engineering and Research @ SonoFields