")
This page contains the data and analysis of a brain wave recording session I did using a Muse EEG Headband.
Session Characteristics
- 24/10/2023, 21:07
- During this session, I was watching a TV show.
- At around 9:30 PM I fell asleep.
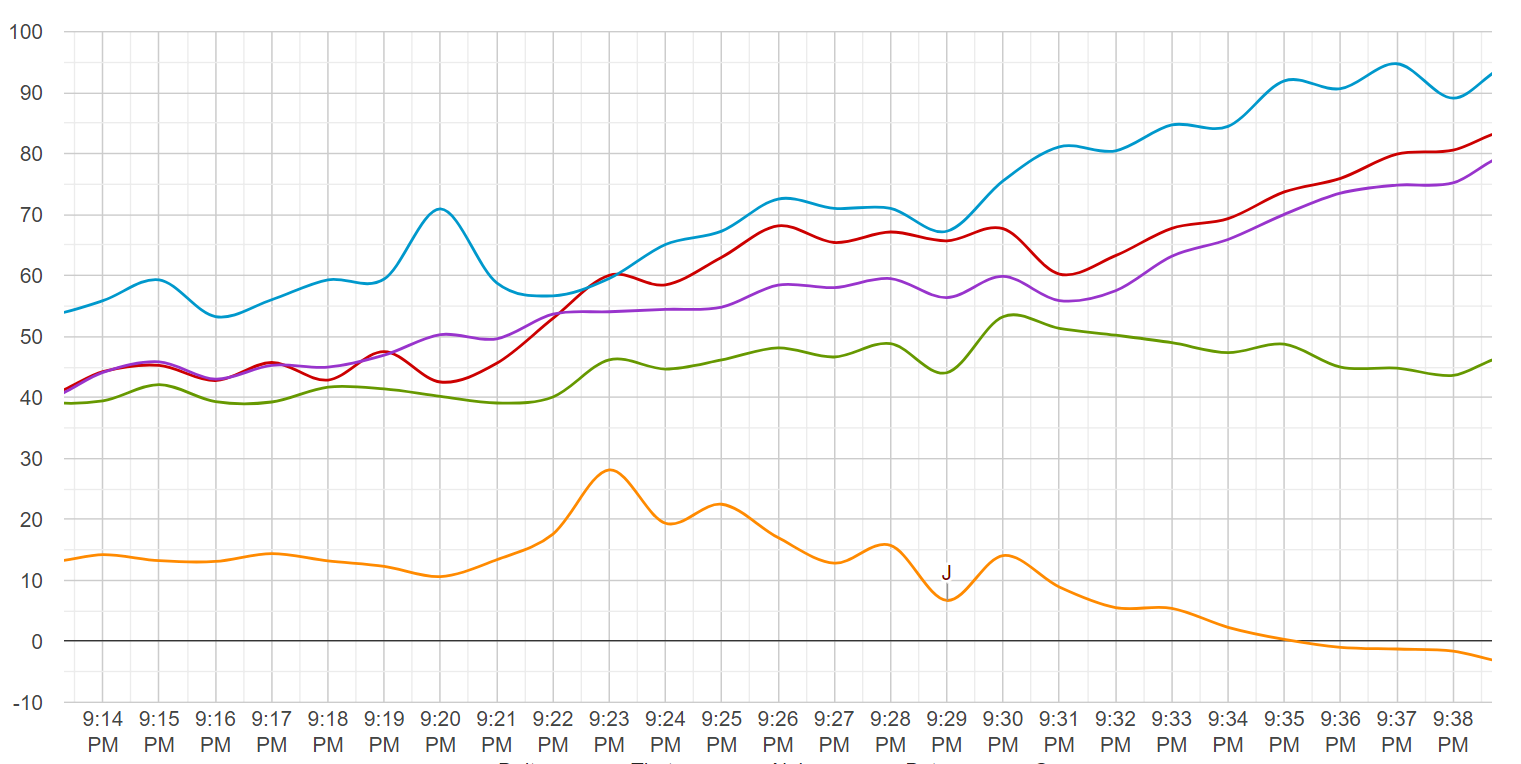
All Sensors (Smoothed Out)
- The frequencies’ relationships from this session are not unexpected. Previous sessions that recorded relaxed states have shown a similar pattern — a low, isolatedGammafrequency, aBetain fourth place of dominance, then Delta andThetaintertwined, and finallyAlphadominating.
- After falling asleep, the range increases —Gammagradually decreases in energy, while the slower brainwaves increase, which is expected during sleep.
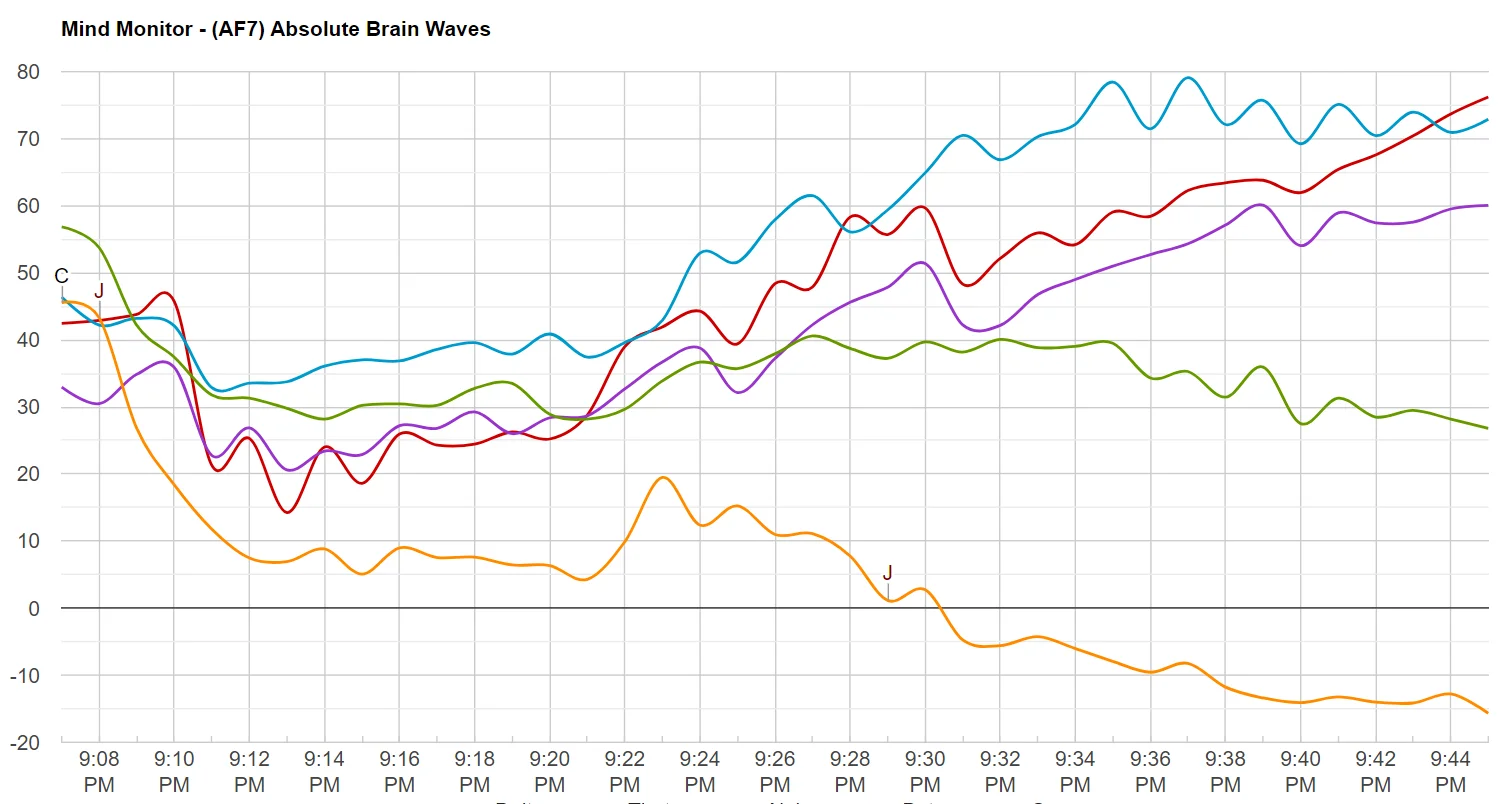
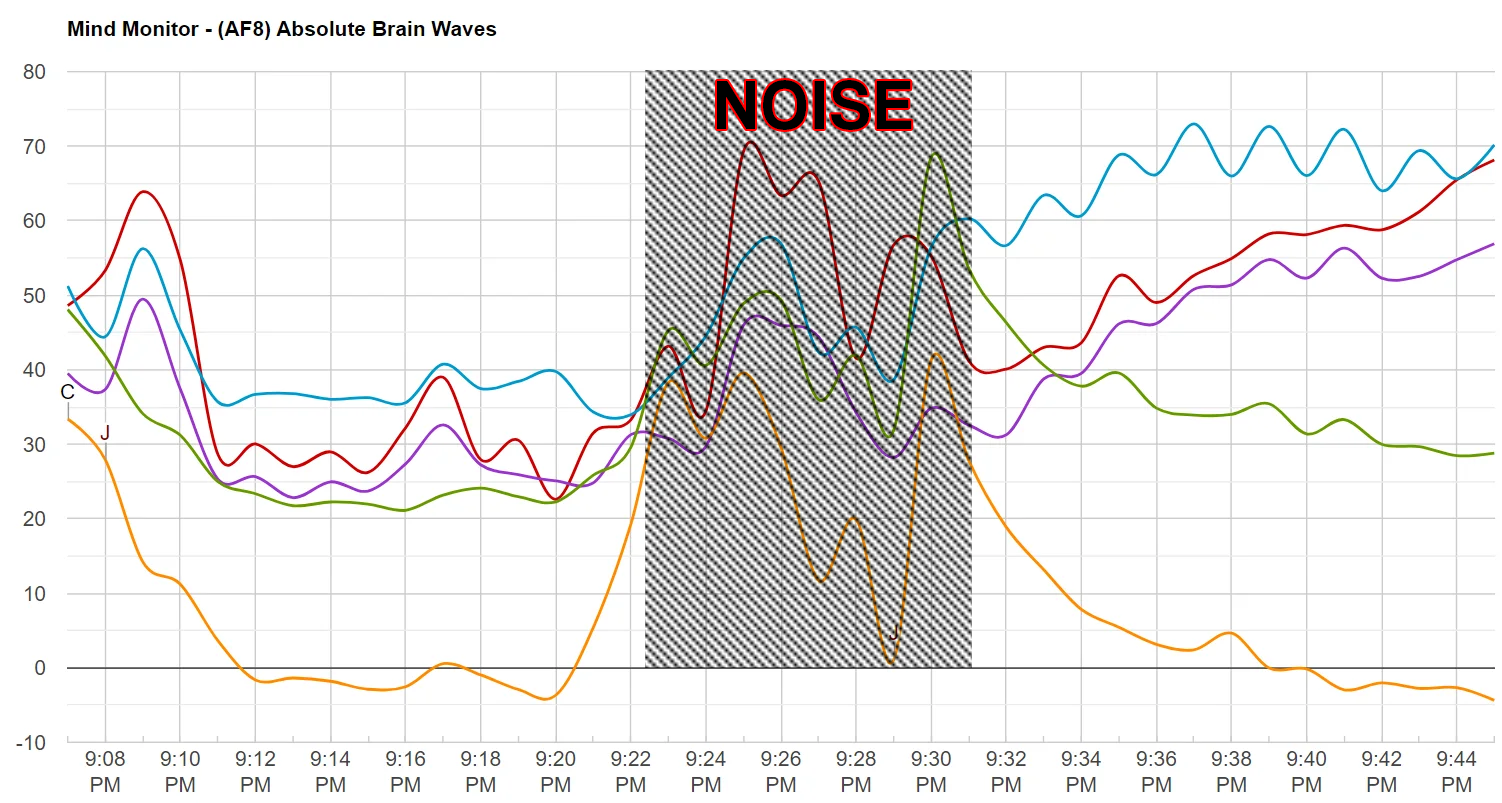
Front Sensors (AF7, AF8)
- Looking at the Front-Left sensor (AF7) and the Front-Right sensor (AF8), some deviations from the graph above are found.
- In AF7, the frequencies’ relationships are still similar, but with the difference being thatBetahas second-place dominance instead. This makes sense to me, since watching a TV show is not a completely relaxed state, and still requires some mental effort to follow the plot.
- In AF8, there is some unusual activity at around 9:22 PM, which lasts about four minutes. I checked, and this was caused by noise. It only affected this sensor.
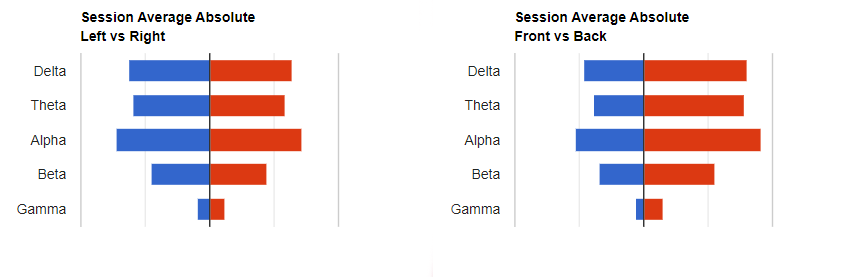
Quadrant Energy Levels (Overview)
Centers of Gravity (Overview)
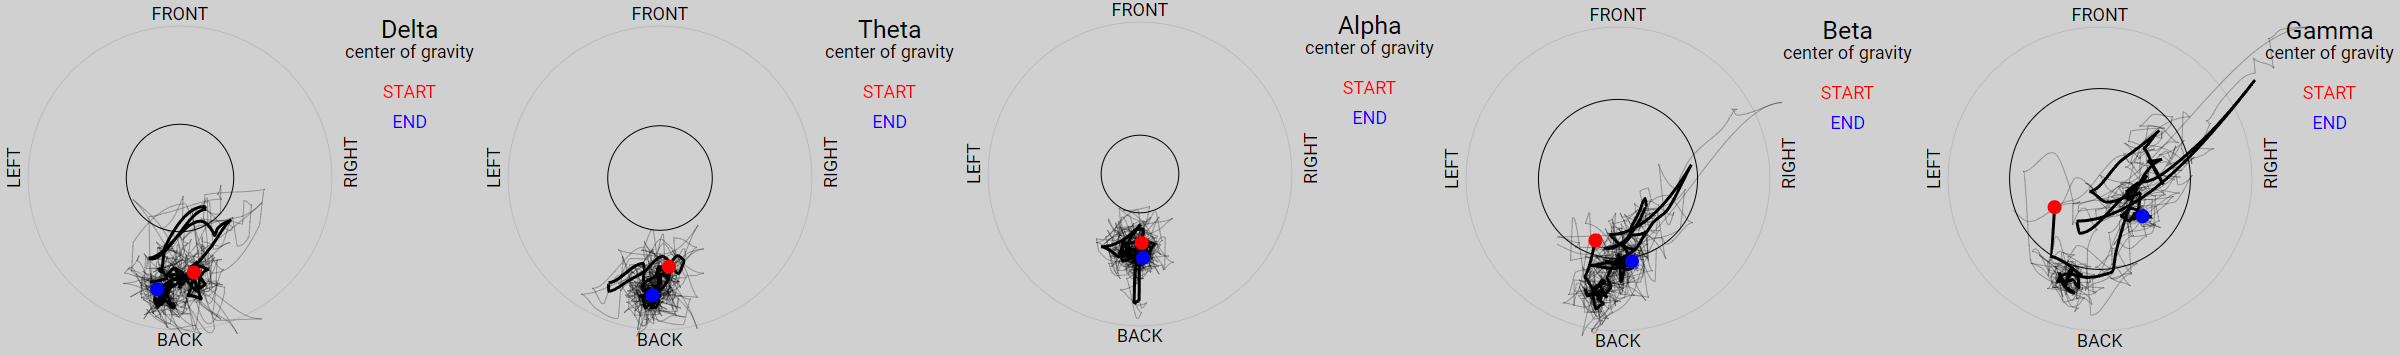
For reference: the circle marks the central area of the brain. Activity inside it is more central and symmetrical; outside is more asymmetrical.
Stay Synced!
The purpose of SonoFields is to explore the secrets of Frequency (the Sinewave). Join the newsletter and I’ll send you some emails about:
▪ The Science: What science has been saying about brain waves and brainwave entrainment, specific frequencies like 432 Hz and 0.1 Hz, and more.
▪ The Esoteric: My ideas on geometrical and mathematical spirituality.
▪ The Practical: How to transform these ideas into practical tools.
Sound Engineering and Research @ SonoFields